Open Access
Fig. B.2
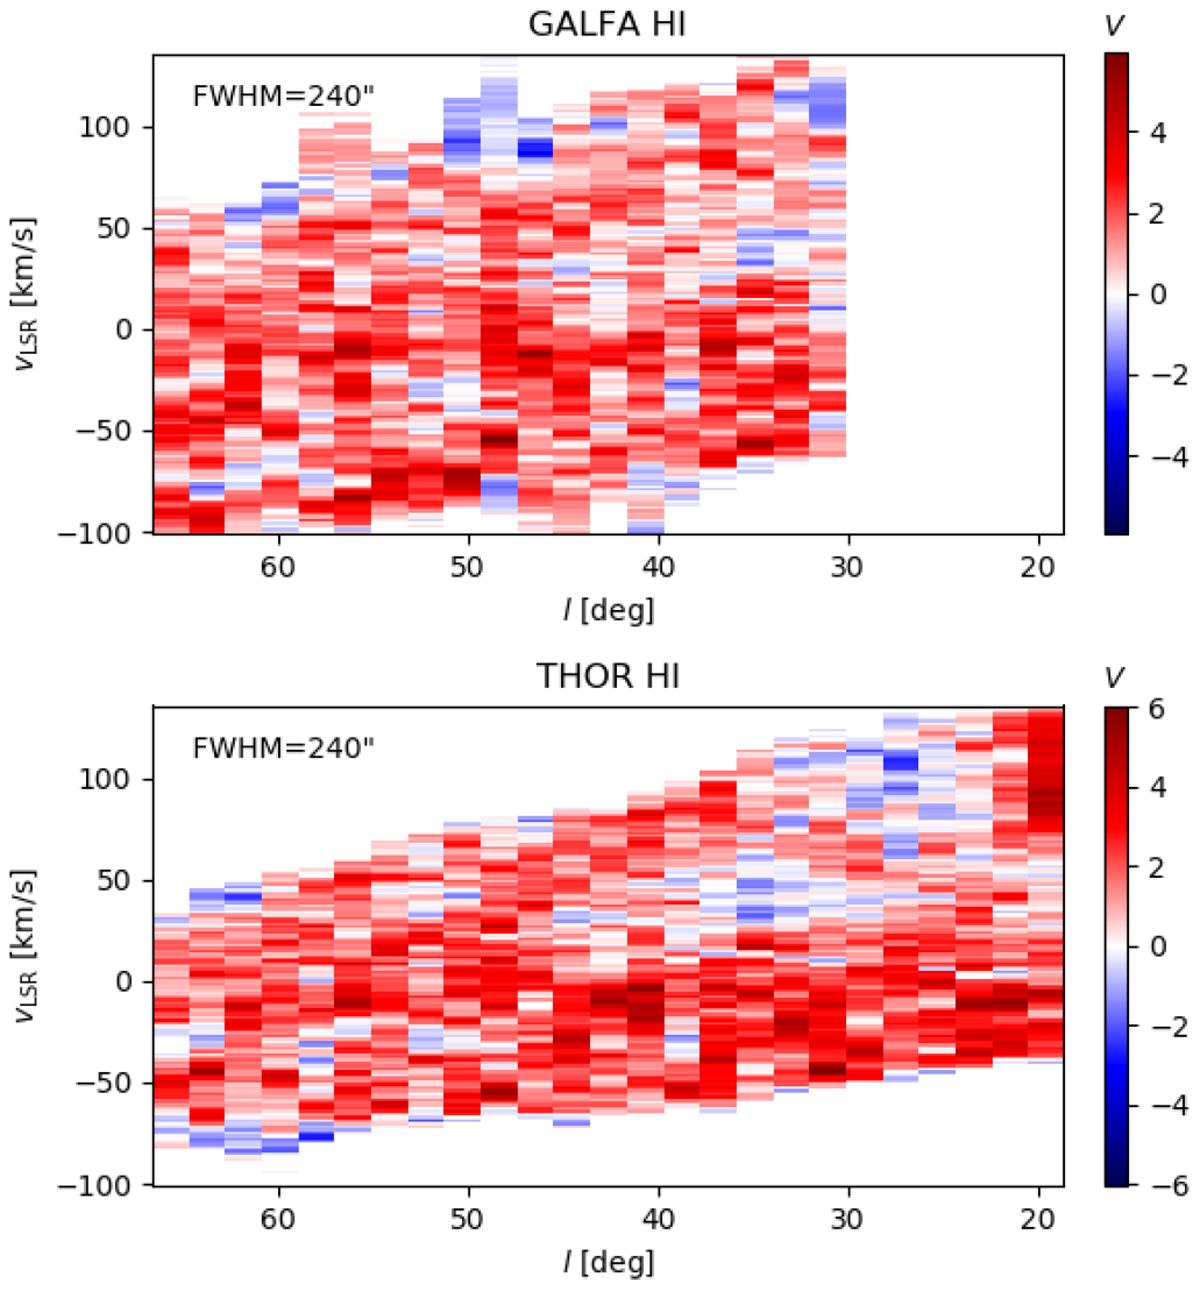
Longitude-velocity diagram of the projected Rayleigh statistic V corresponding to the results of the Hessian analysis of the GALFA-HI and THOR-HI observations, shown in the top and bottom. Both results were obtained with the same derivative kernel size, indicated in the figure.
Current usage metrics show cumulative count of Article Views (full-text article views including HTML views, PDF and ePub downloads, according to the available data) and Abstracts Views on Vision4Press platform.
Data correspond to usage on the plateform after 2015. The current usage metrics is available 48-96 hours after online publication and is updated daily on week days.
Initial download of the metrics may take a while.