Open Access
Fig. 18
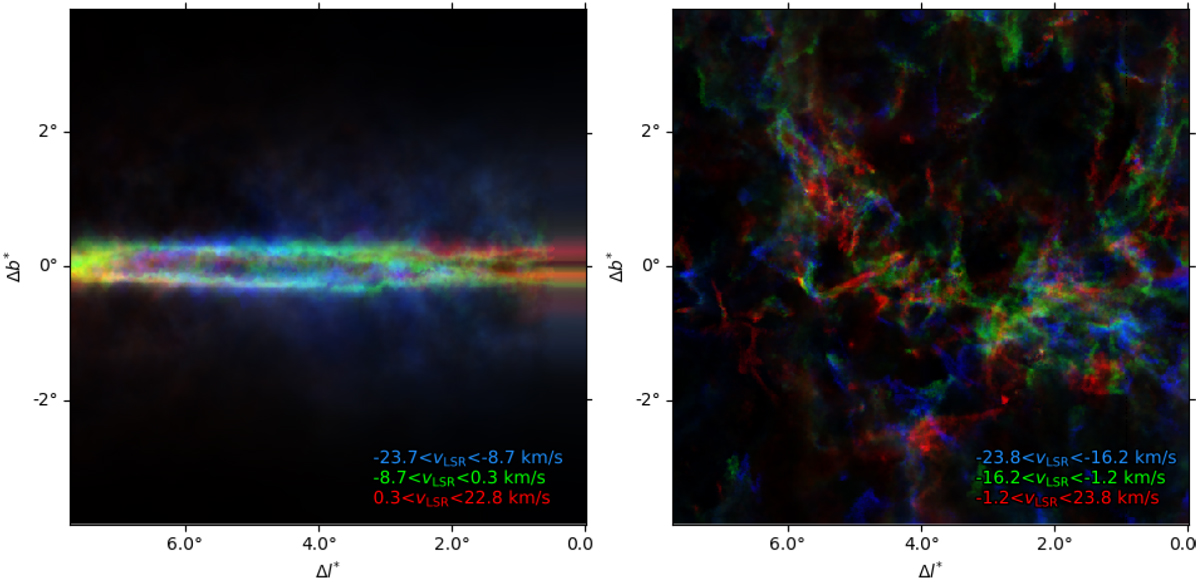
Synthetic observations of the HI emission from the potential and feedback dominated CloudFactory simulations, presented in the left and right panels, respectively. The colors represent the emission in the three indicated radial velocity bins, each with the same average emission.
Current usage metrics show cumulative count of Article Views (full-text article views including HTML views, PDF and ePub downloads, according to the available data) and Abstracts Views on Vision4Press platform.
Data correspond to usage on the plateform after 2015. The current usage metrics is available 48-96 hours after online publication and is updated daily on week days.
Initial download of the metrics may take a while.