Fig. 1
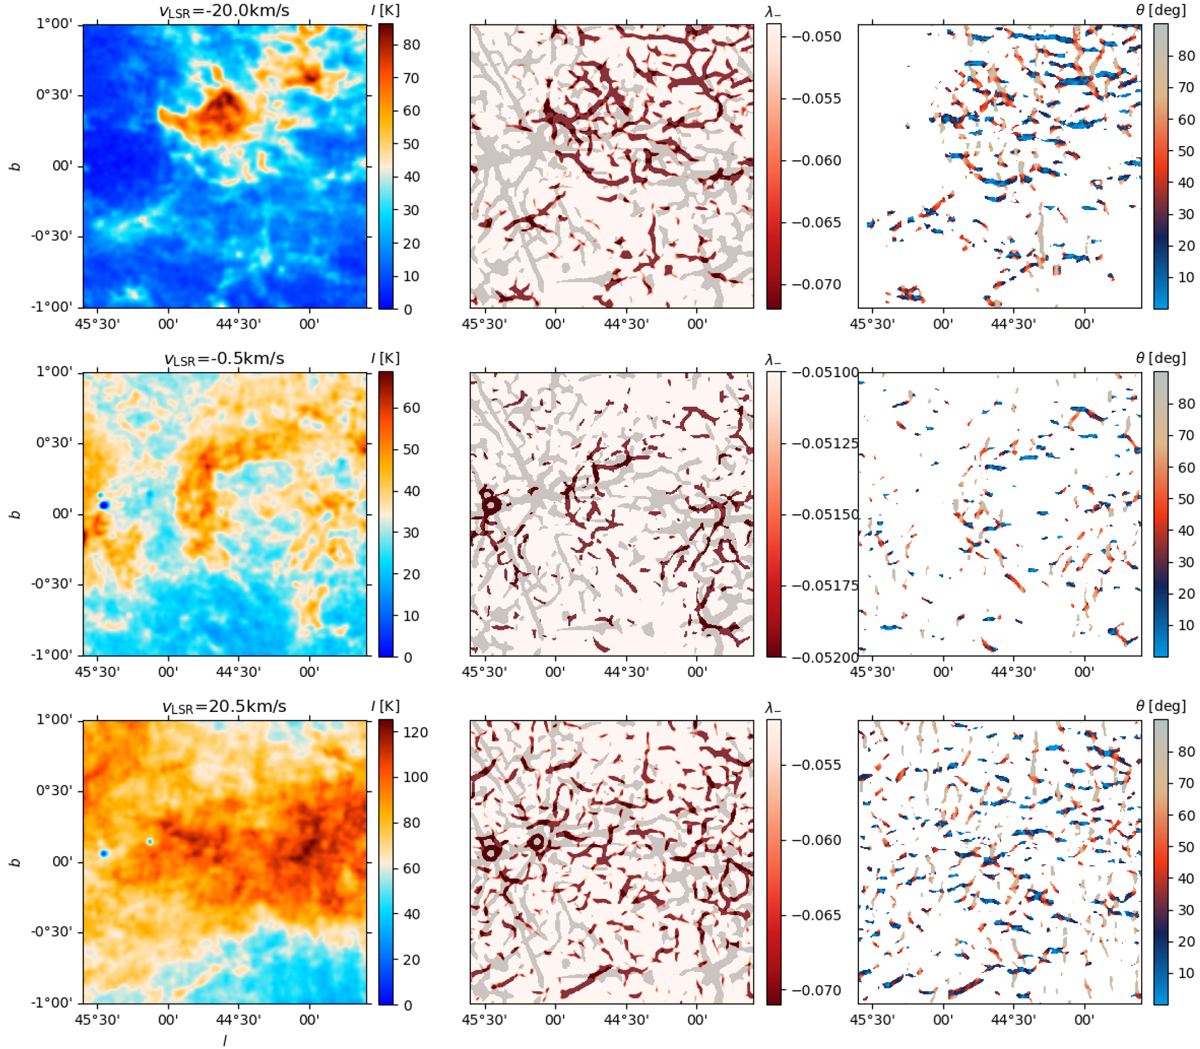
Examples of the Hessian analysis applied to three different velocity-channel maps toward a section of the Galactic plane observed by THOR. Left: intensity map. Center: map of the eigenvalue of the Hessian matrix identified as λ− in Eq. (2), which is used to characterize the filamentary structures in the intensity map. The overlaid gray map shows the filamentary structure obtained from the Hessian matrix analysis of the continuum noise maps, see Appendix A for details. Right: map of the orientation angles evaluated using Eq. (3).
Current usage metrics show cumulative count of Article Views (full-text article views including HTML views, PDF and ePub downloads, according to the available data) and Abstracts Views on Vision4Press platform.
Data correspond to usage on the plateform after 2015. The current usage metrics is available 48-96 hours after online publication and is updated daily on week days.
Initial download of the metrics may take a while.