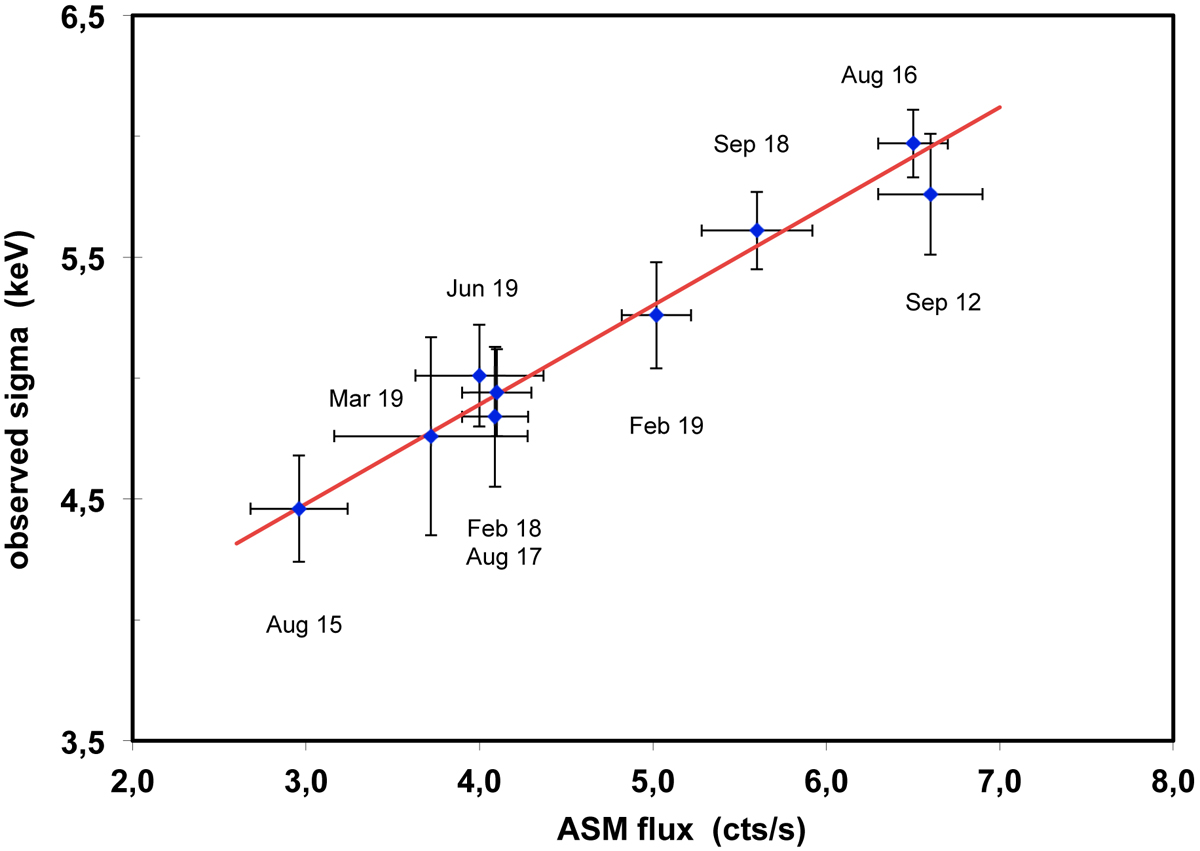
Fig. 3.

Correlation between the measured values of the width (sigma) of the cyclotron line and the X-ray flux. The fit takes into account nine measurements by NuSTAR from 2012 to 2019 (see Table 1). The best-fit line is given by the function sigcyc = (5.30 ± 0.09)+ (0.41 ± 0.07)×((ASM-cts s−1)−5.0) (all values in keV). The Pearson linear correlation coefficient is 0.99.
Current usage metrics show cumulative count of Article Views (full-text article views including HTML views, PDF and ePub downloads, according to the available data) and Abstracts Views on Vision4Press platform.
Data correspond to usage on the plateform after 2015. The current usage metrics is available 48-96 hours after online publication and is updated daily on week days.
Initial download of the metrics may take a while.


