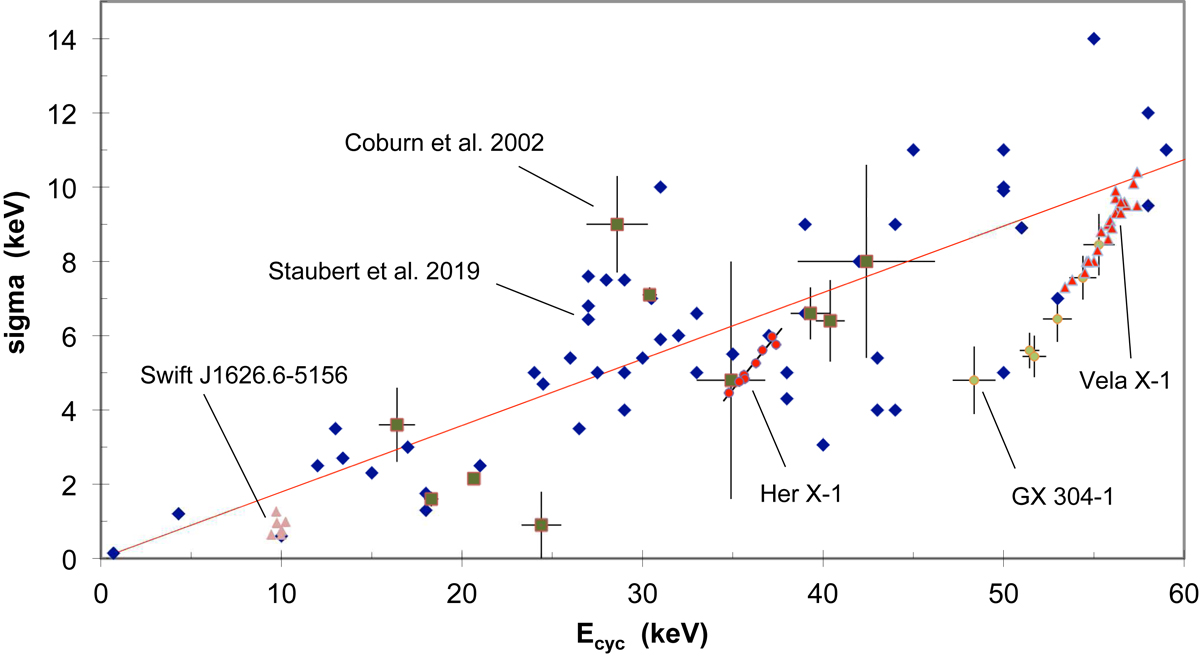
Fig. 14.

Correlation between the width (sigma) and the centroid energy of cyclotron lines for different X-ray binaries. The blue rhombs are data from the compilation in Staubert et al. (2019), the filled squares (with uncertainties) are from Coburn et al. (2002). The red line is a fit to these two data sets defining σ = 0.18 Ecyc. The individual sources are GX 304−1 (Klochkov et al. 2015), Swift J1626.6−5156 (DeCesar et al. 2013), Vela X-1 (La Parola et al. 2016), and Her X-1 (same as Fig. 4).
Current usage metrics show cumulative count of Article Views (full-text article views including HTML views, PDF and ePub downloads, according to the available data) and Abstracts Views on Vision4Press platform.
Data correspond to usage on the plateform after 2015. The current usage metrics is available 48-96 hours after online publication and is updated daily on week days.
Initial download of the metrics may take a while.


