Fig. 4
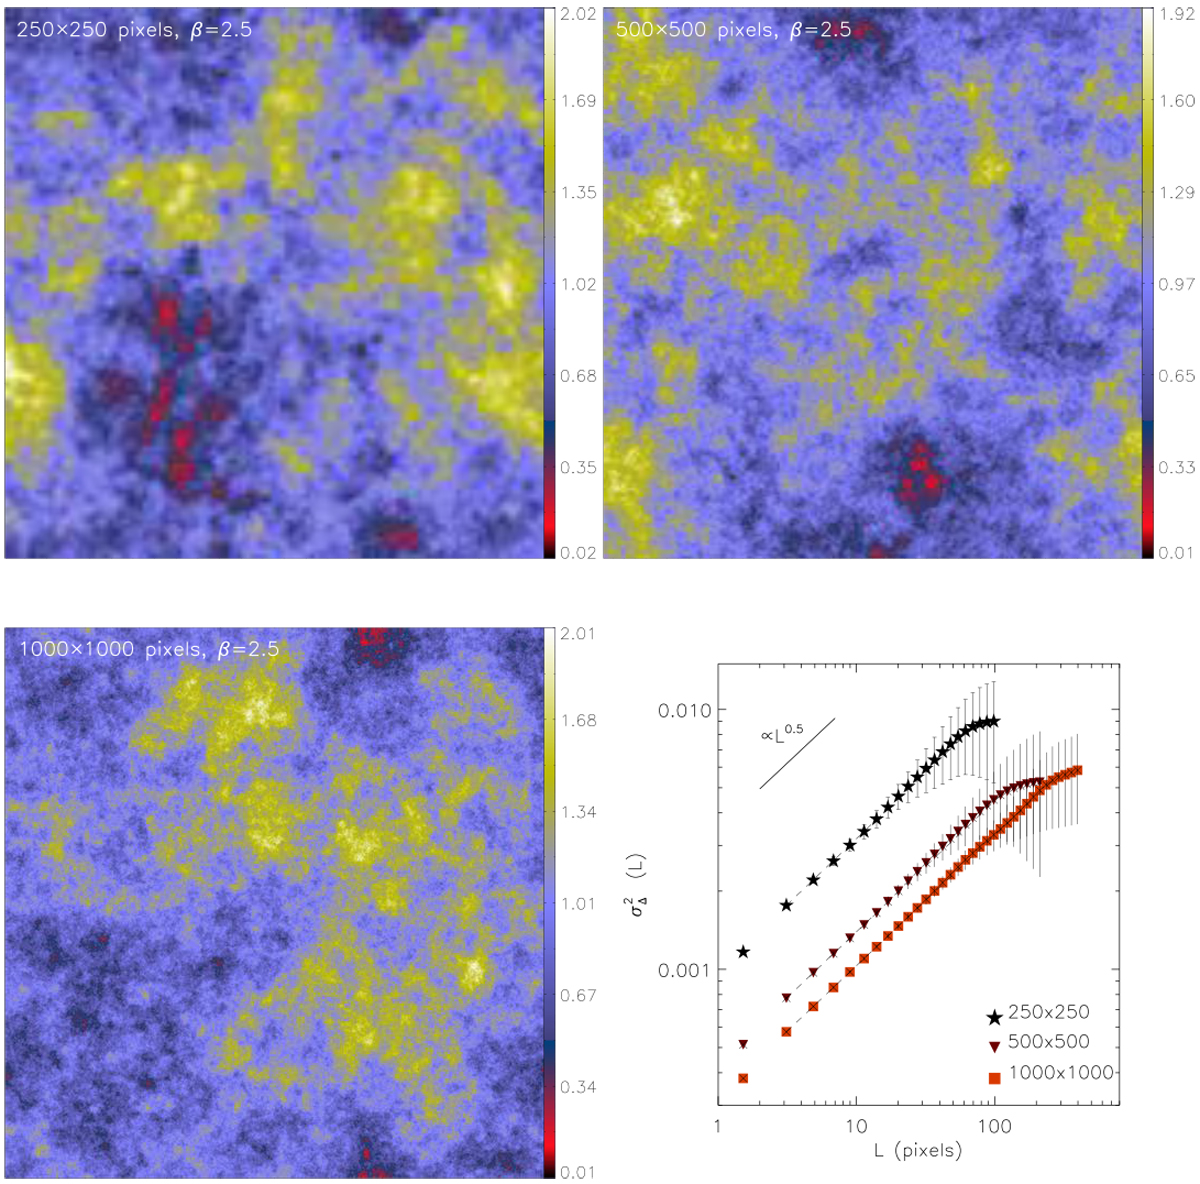
fBm images with β = 2.5 and with resolutions of 250 × 250 pixels (top left), 500 × 500 pixels (top right), and 1000 × 1000 pixels (bottom left). The Δ-variance spectra for all three cases are compared in the bottom-right subpanel. All display a self-similar regime with an exponent of the power law of α = β − 2 (i.e., Eq. (4)). All maps are normalized by their own mean value, and the vertical offset between the three Δ-variance functions simply reflects the effect of this different normalization.
Current usage metrics show cumulative count of Article Views (full-text article views including HTML views, PDF and ePub downloads, according to the available data) and Abstracts Views on Vision4Press platform.
Data correspond to usage on the plateform after 2015. The current usage metrics is available 48-96 hours after online publication and is updated daily on week days.
Initial download of the metrics may take a while.