Fig. 3
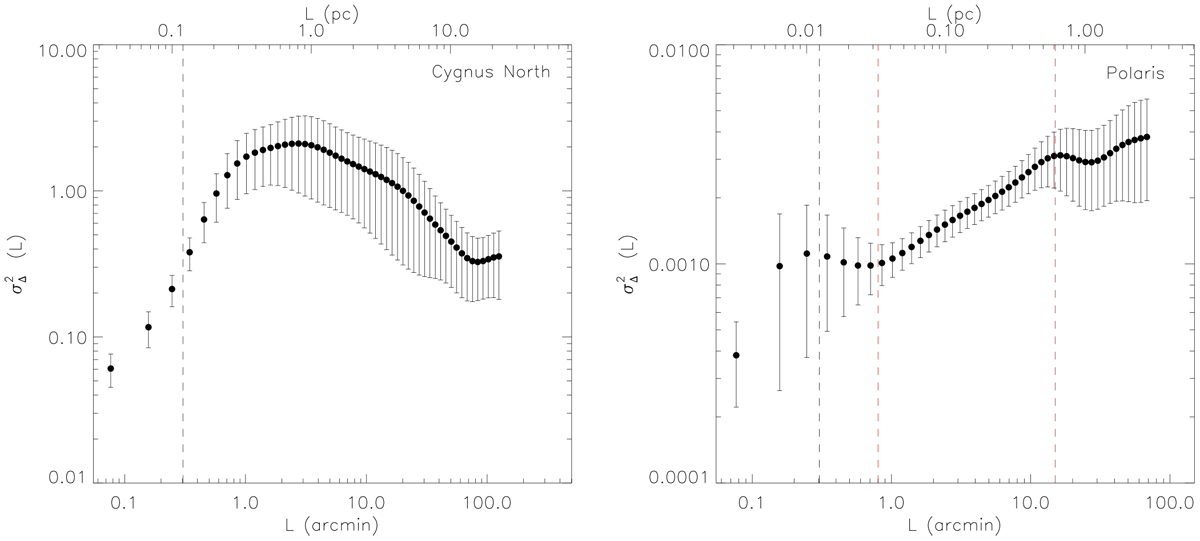
Delta-variance functions calculated for the Cygnus-X North cloud (left) and the Polaris Flare cloud (right). The vertical dashed black lines in both panels mark the position of the spatial resolution for each of these two regions. The vertical dashed red lines in the case of Polaris mark the spatial range over which the power-law fit is performed. We do not attemptany fit in Cygnus-X North because the underlying self-similar regime is heavily perturbed by the presence of structures (see Sect. 6.3).
Current usage metrics show cumulative count of Article Views (full-text article views including HTML views, PDF and ePub downloads, according to the available data) and Abstracts Views on Vision4Press platform.
Data correspond to usage on the plateform after 2015. The current usage metrics is available 48-96 hours after online publication and is updated daily on week days.
Initial download of the metrics may take a while.