Fig. 2
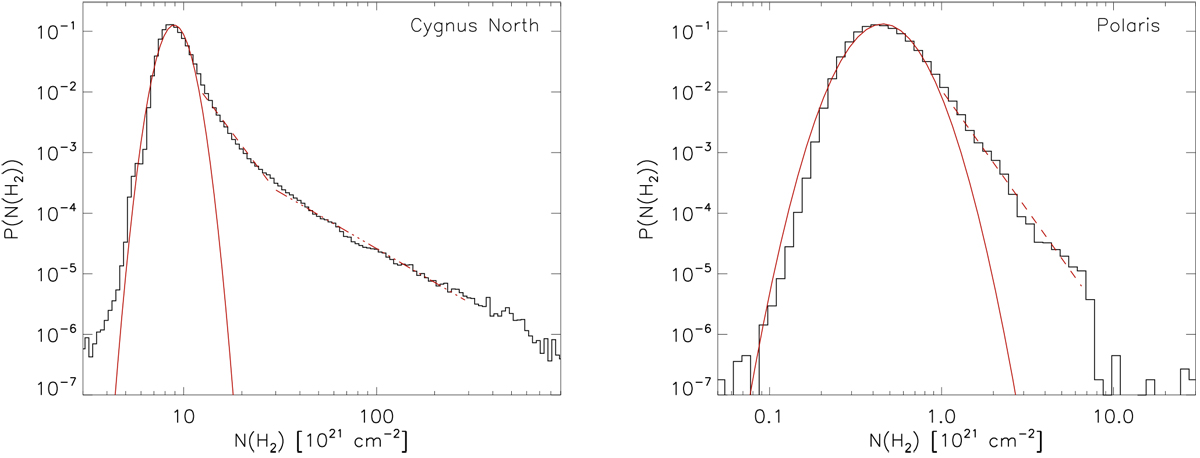
Column density distribution function in the Cygnus-X North cloud (left panel) and the Polaris Flare cloud (right panel). The full red lines in both panels show a fit by a lognormal function in the low column density regime (≲ 5 × 1021 cm−2 in Cygnus-X North and ≲1 × 1021 cm2 in Polaris). The dashed line is a fit to the power-law regime that is observed in both regions in the intermediate column density regime, while the triple-dot dashed red line in the case of the Cygnus-X North region is a fit to the shallower power law in the high column density regime.
Current usage metrics show cumulative count of Article Views (full-text article views including HTML views, PDF and ePub downloads, according to the available data) and Abstracts Views on Vision4Press platform.
Data correspond to usage on the plateform after 2015. The current usage metrics is available 48-96 hours after online publication and is updated daily on week days.
Initial download of the metrics may take a while.