Fig. 18
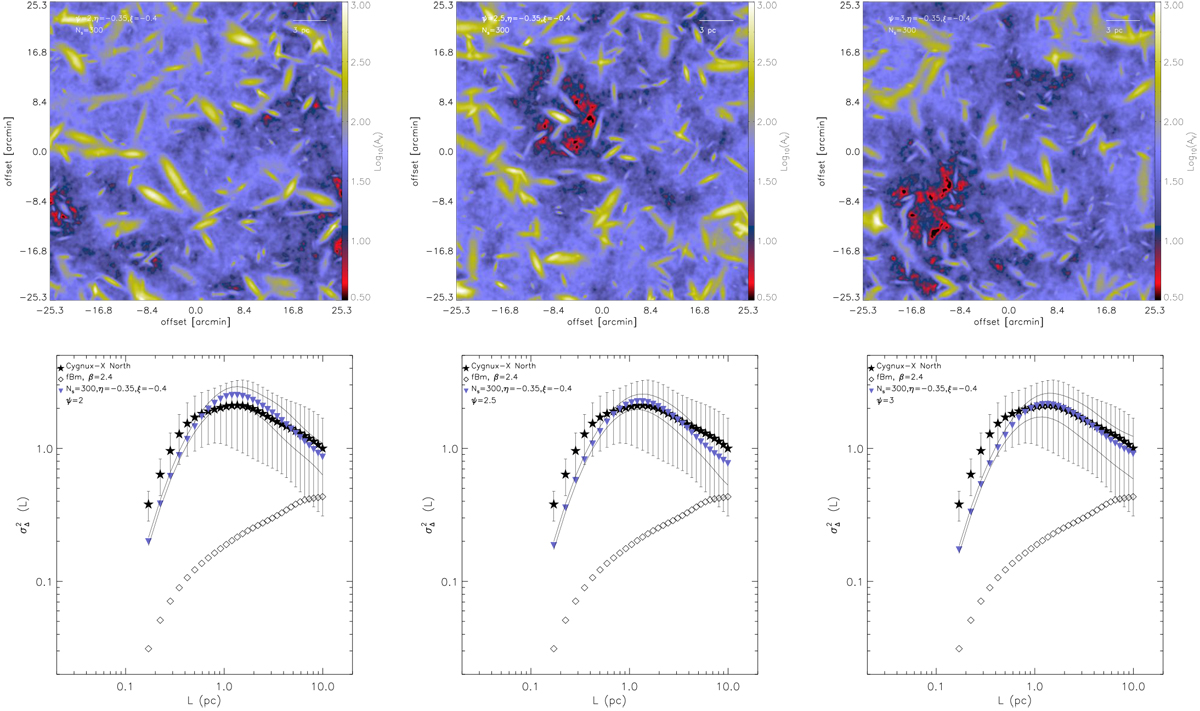
Top: examples of 2D Gaussian structures injected on top of an fBm image with β = 2.4. The maps only differ in the values of the exponent ψ. All other parameters have the same values (see text for details). All synthetic maps are convolved with a beam whose FWHM = 18.2′′. Bottom: Δ-variance spectrum spectra of the synthetic models for the three cases with ψ = 2, 2.5, and 3. Each synthetic spectrum is the average over 25 realizations, and the full lines represent the 1σ dispersion around the mean. The synthetic Δ-variance spectra are compared to that of the Cygnus-X North region and that of an fBm image with β = 2.4.
Current usage metrics show cumulative count of Article Views (full-text article views including HTML views, PDF and ePub downloads, according to the available data) and Abstracts Views on Vision4Press platform.
Data correspond to usage on the plateform after 2015. The current usage metrics is available 48-96 hours after online publication and is updated daily on week days.
Initial download of the metrics may take a while.