Fig. 15
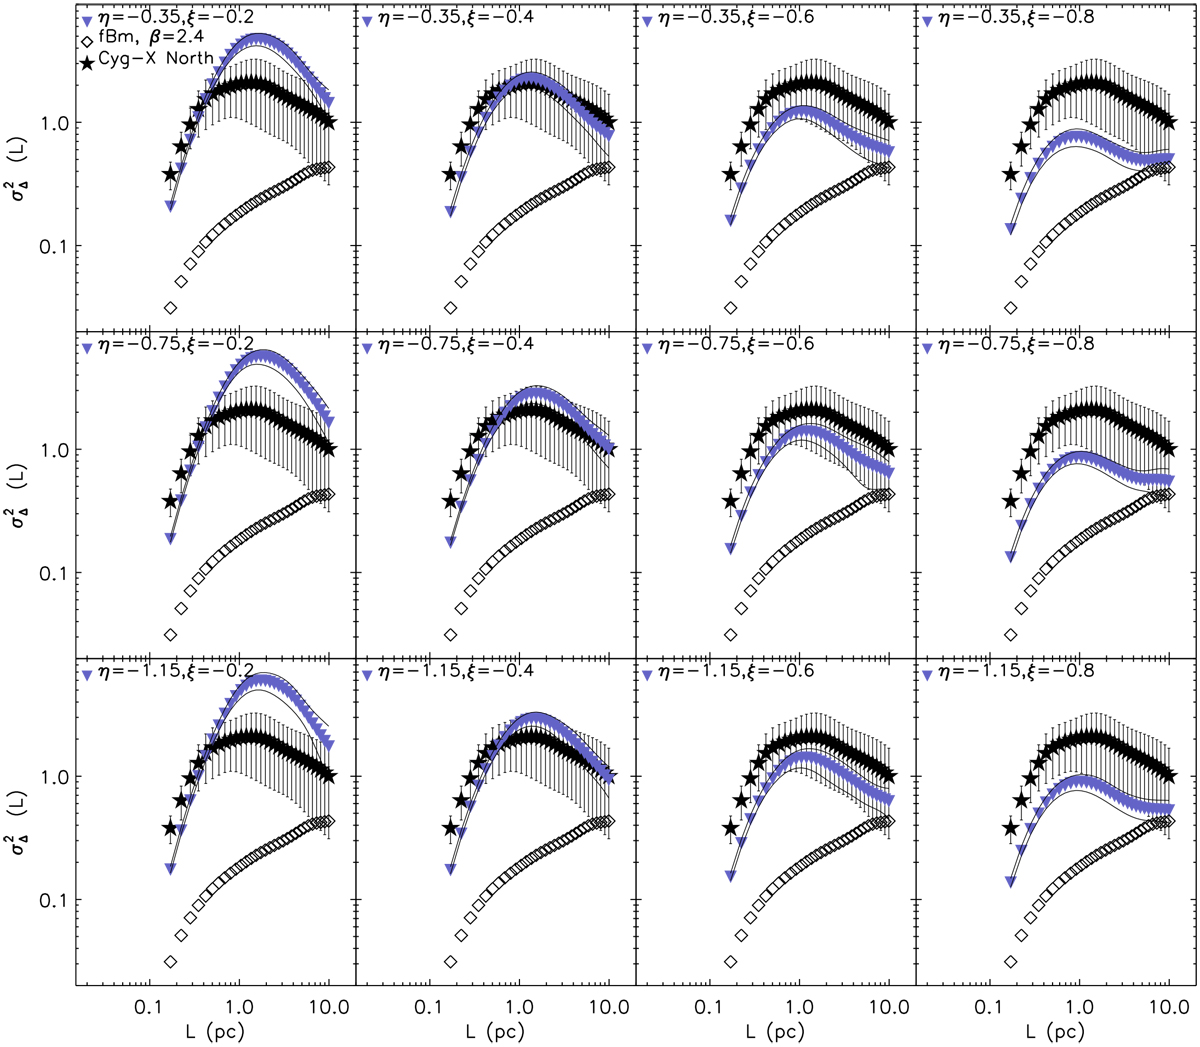
Δ-variance spectra related to the models presented in Fig. 14. Each synthetic spectrum (blue triangles) is the average over 25 realizations of the maps with the same set of parameters. In all models, Ns = 300 and ψ = 2.5. The full line is the 1σ dispersion around the mean. The synthetic Δ-variance spectra are compared to that of the Cygnus-X North region and that of an fBm image with β = 2.4. In the grid of models, the best fit to the data of Cygnus North is for the case with ξ = −0.4 and η = −0.35.
Current usage metrics show cumulative count of Article Views (full-text article views including HTML views, PDF and ePub downloads, according to the available data) and Abstracts Views on Vision4Press platform.
Data correspond to usage on the plateform after 2015. The current usage metrics is available 48-96 hours after online publication and is updated daily on week days.
Initial download of the metrics may take a while.