Fig. 12
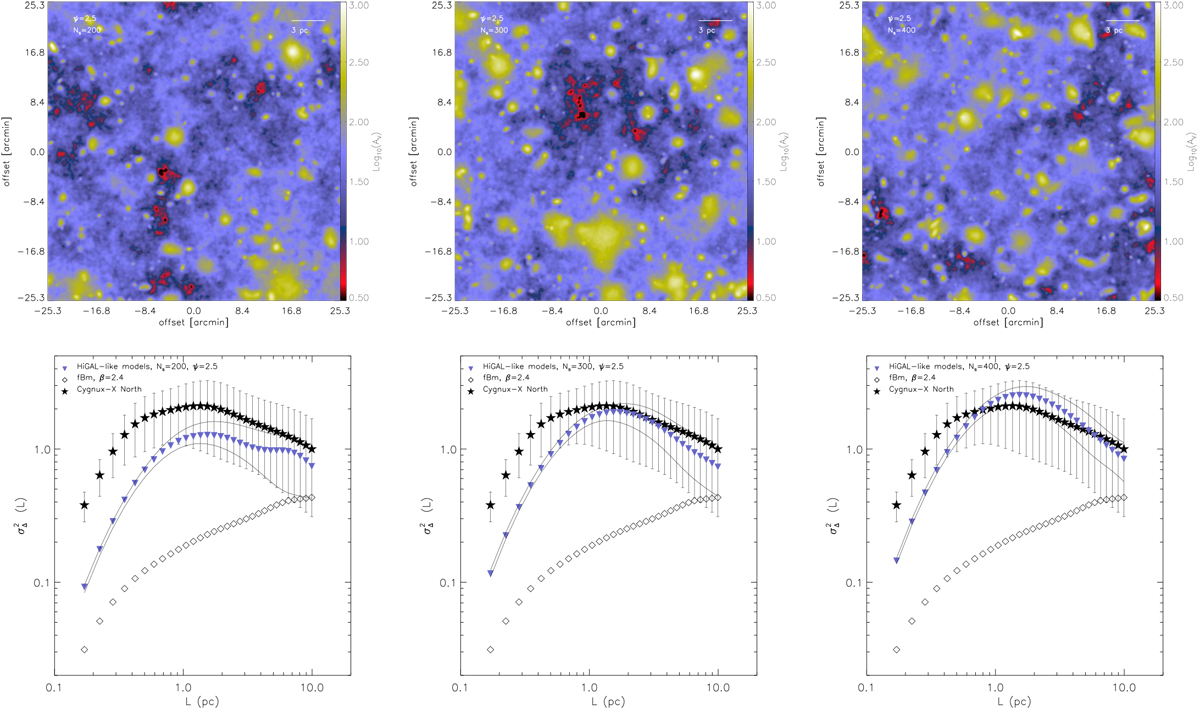
Top: examples of 200 (left), 300 (middle), and 400 (right) 2D Gaussian structures injected on top of an fBm image with β = 2.4. The Gaussian structures are randomly sampled using the distribution functions of the major axis size and aspect ratio distributions of the Hi-GAL clumps. The column density contrasts are randomly sampled from a distribution with ψ = 2.5. All syntheticmaps are convolved with a beam whose FWHM = 18.2′′. Bottom: Δ-variance spectrum of the synthetic models for cases with Ns = 200 (left), Ns = 300 (middle), and Ns = 400 (right) injected structures. Each synthetic spectrum is the average over 25 realizations, and the full lines represent the 1σ dispersion around the mean. The synthetic Δ-variance spectra are compared to those of the Cygnus-X North region and an fBm with β = 2.4.
Current usage metrics show cumulative count of Article Views (full-text article views including HTML views, PDF and ePub downloads, according to the available data) and Abstracts Views on Vision4Press platform.
Data correspond to usage on the plateform after 2015. The current usage metrics is available 48-96 hours after online publication and is updated daily on week days.
Initial download of the metrics may take a while.