Fig. 10
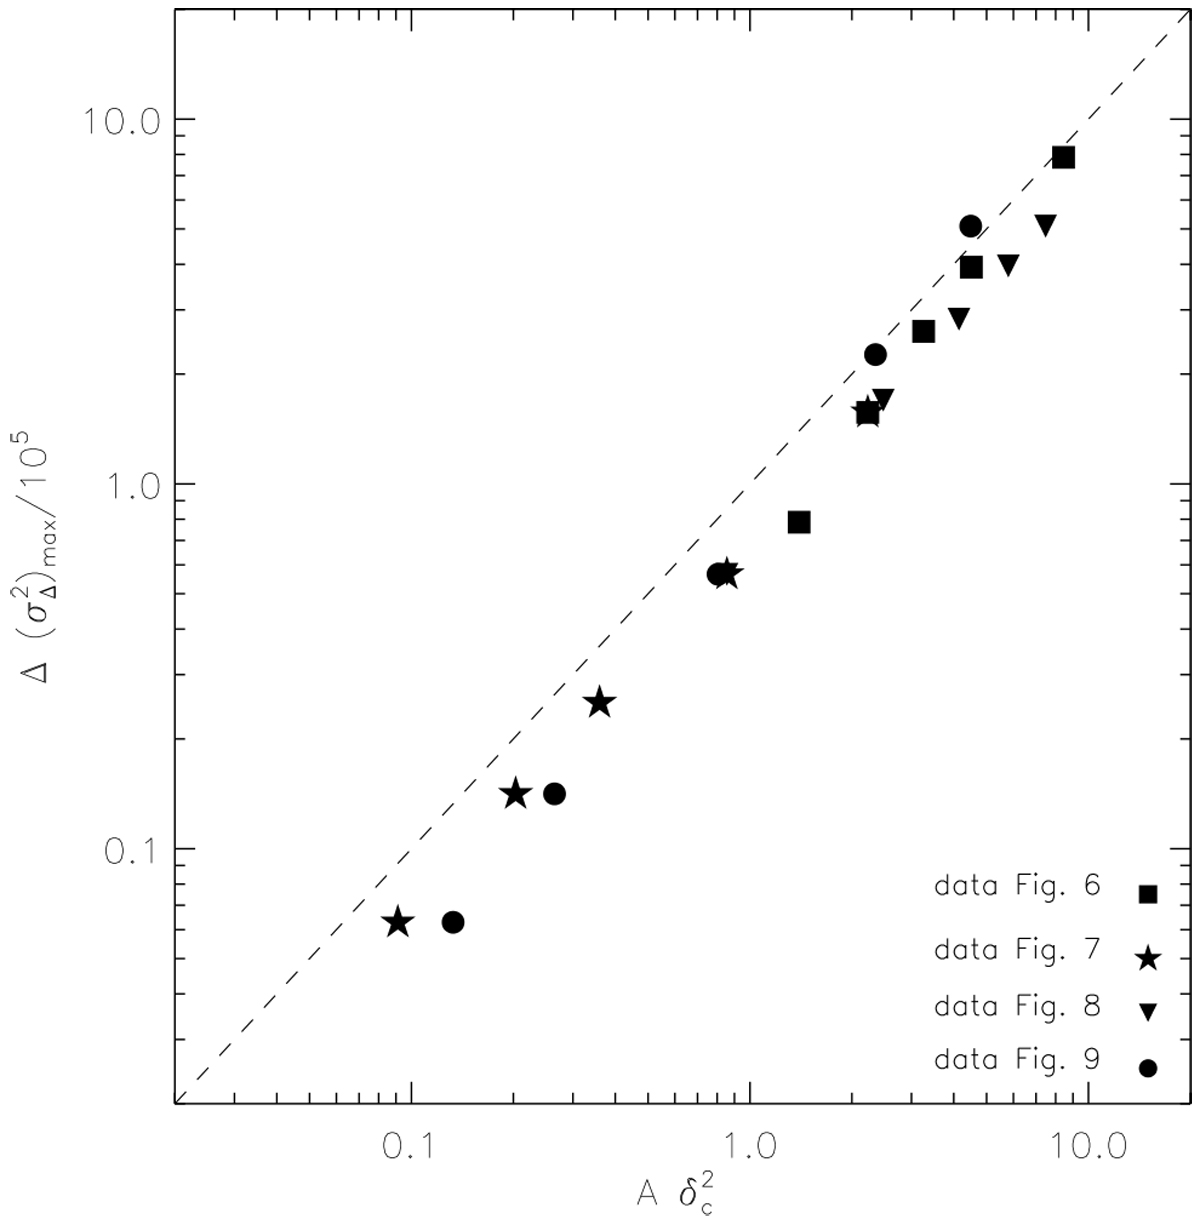
Maximum deviation of the Δ-variance function in the presence of structures from that of a pure fBm as a function of the quantity
![]() , where A
is the area covered by the discrete structure(s) and δc
is the column density contrast between the peak of the structure and the mean value of the underlying fBm. The dashed line has a slope of one.
, where A
is the area covered by the discrete structure(s) and δc
is the column density contrast between the peak of the structure and the mean value of the underlying fBm. The dashed line has a slope of one.
Current usage metrics show cumulative count of Article Views (full-text article views including HTML views, PDF and ePub downloads, according to the available data) and Abstracts Views on Vision4Press platform.
Data correspond to usage on the plateform after 2015. The current usage metrics is available 48-96 hours after online publication and is updated daily on week days.
Initial download of the metrics may take a while.