Open Access
Fig. 1
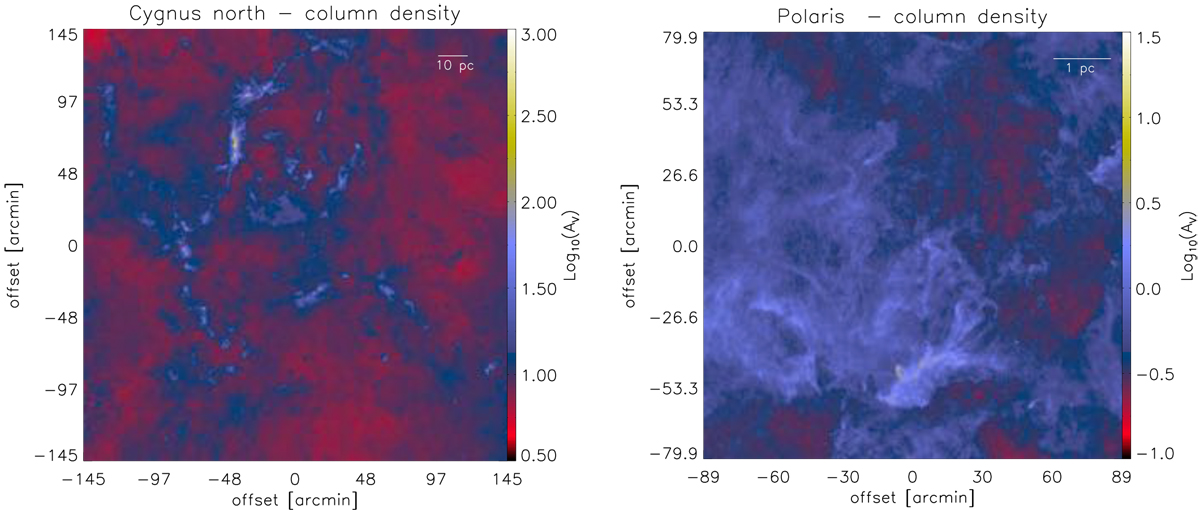
Column density maps of the Cygnus-X North cloud (left) and the Polaris Flare cloud (right). Column densities are displayed in units of the visual extinction using the conversion
![]() cm−2.
cm−2.
Current usage metrics show cumulative count of Article Views (full-text article views including HTML views, PDF and ePub downloads, according to the available data) and Abstracts Views on Vision4Press platform.
Data correspond to usage on the plateform after 2015. The current usage metrics is available 48-96 hours after online publication and is updated daily on week days.
Initial download of the metrics may take a while.