Fig. 2.
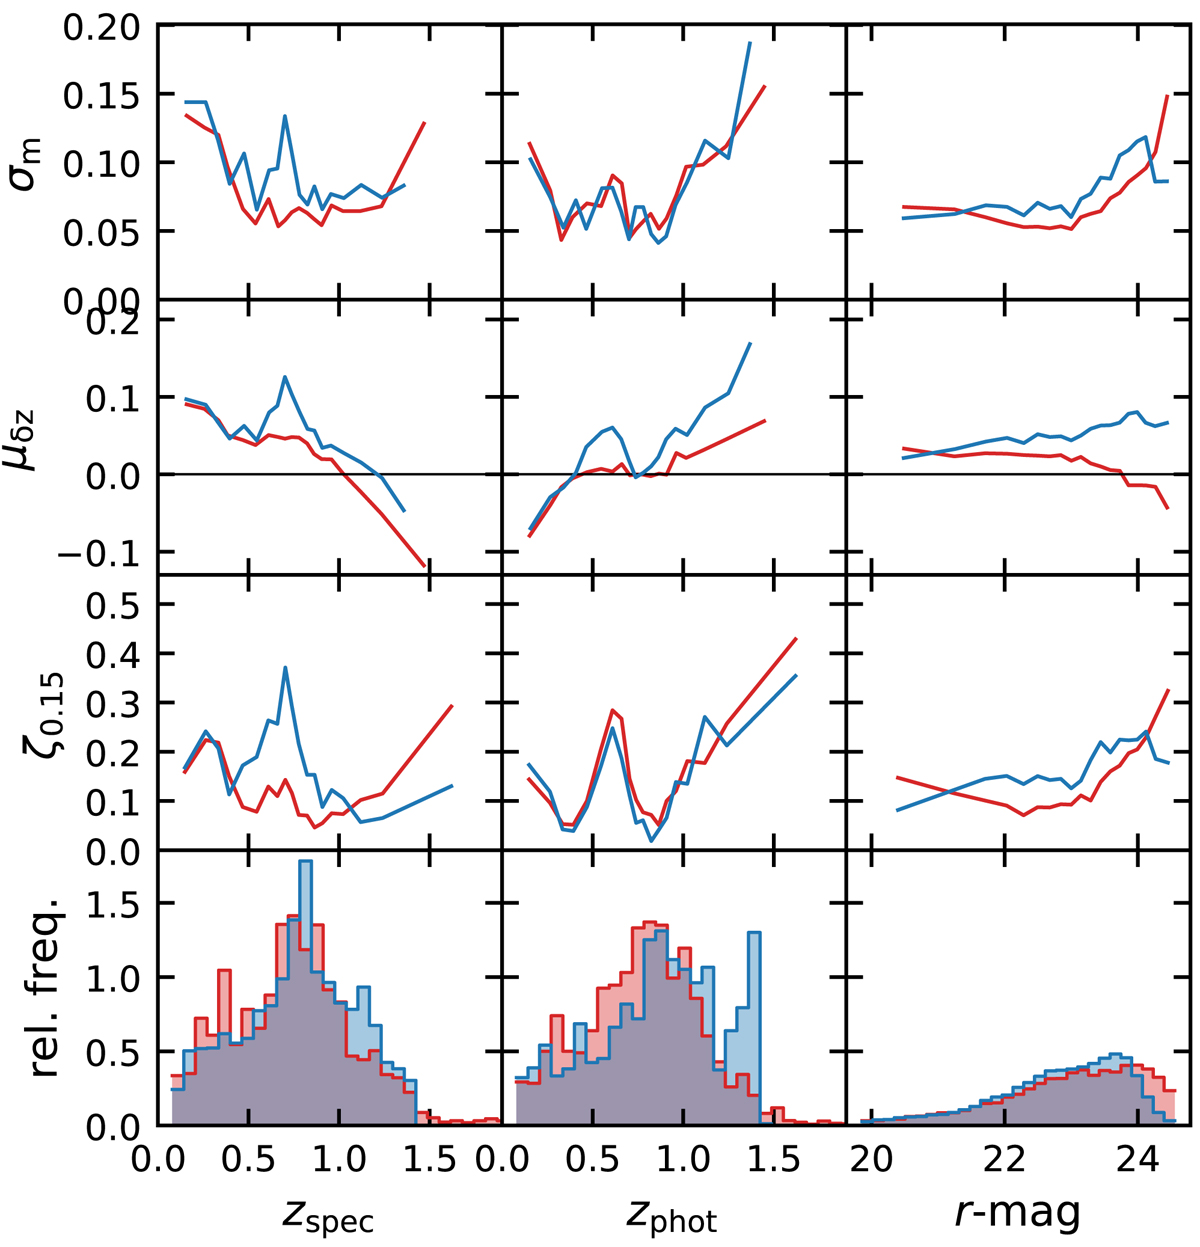
Comparison of statistics of the scaled photo-z bias δz = (zB − zspec)/(1 + zspec) of the KV450 (red) and MICE2 mock (blue) datasets. The galaxies used for this compilation originate from DEEP2, VVDS, and zCOSMOS. The columns from left to right show statistics as a function of spectroscopic redshift, photometric, and r-band magnitude (shown as histograms in the bottom row). The rows from top to bottom show the median-absolute-deviation (σm), mean (μδz), and the outlier fraction (ζ0.15, the fraction of objects with δz > 0.15).
Current usage metrics show cumulative count of Article Views (full-text article views including HTML views, PDF and ePub downloads, according to the available data) and Abstracts Views on Vision4Press platform.
Data correspond to usage on the plateform after 2015. The current usage metrics is available 48-96 hours after online publication and is updated daily on week days.
Initial download of the metrics may take a while.