Fig. 9.
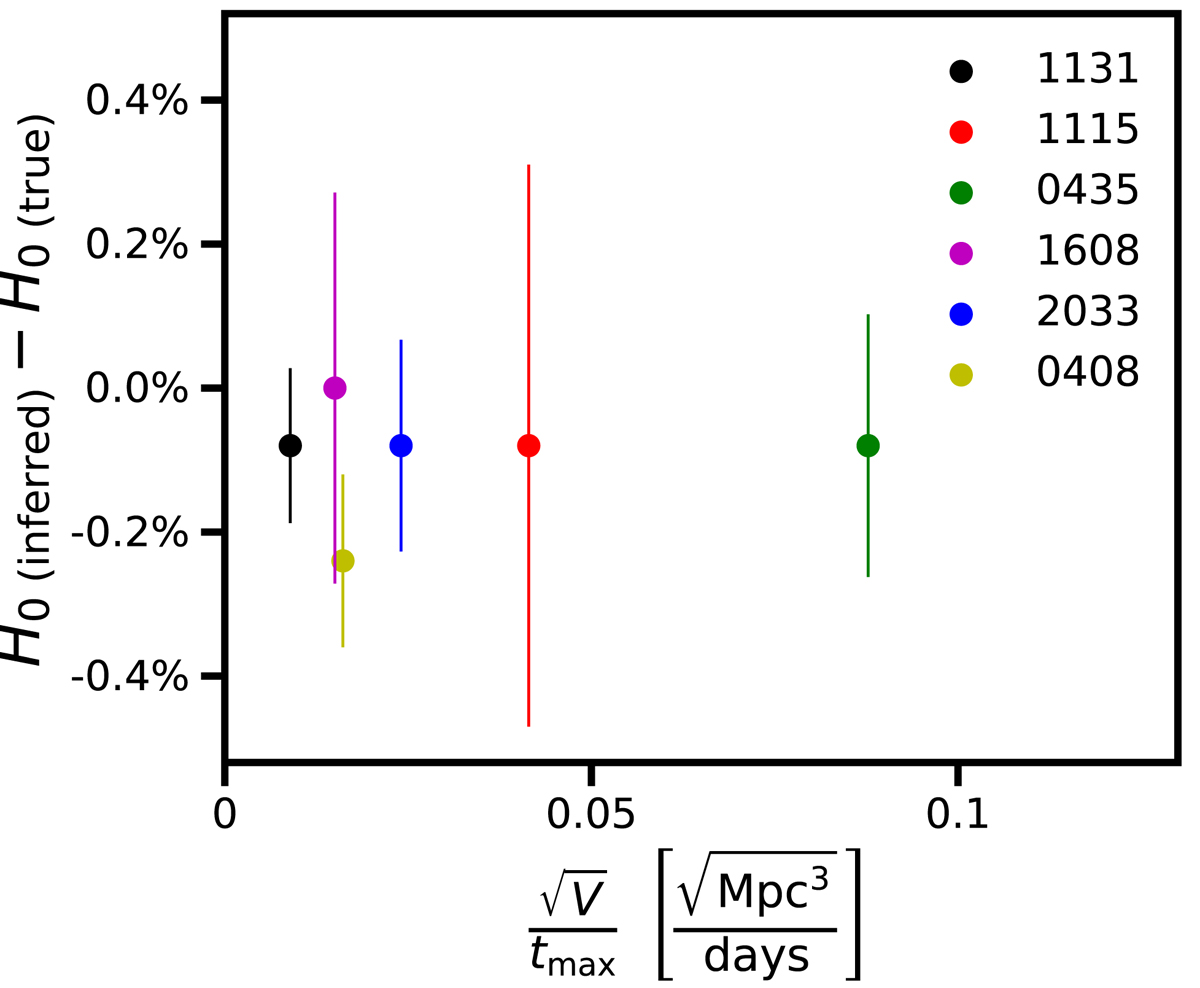
The y-axis shows the bias in H0, defined as the median of the H0 posterior obtained from the substructure-perturbed datasets minus the median of the posterior from the control datasets. The mock lenses are sorted on the x-axis by the square root of the lensing volume divided by the longest time delay, a dimensional quantity that determines the additional uncertainty caused by substructure in the lens system. The error bars show the statistical uncertainty on the median, which is given by ![]() , where σcontrol is the uncertainty in H0 from the control dataset and N = 200 is the number of realizations. We find no evidence for bias in the inferred value of H0 stemming from substructure that is not modeled in cosmographic inferences.
, where σcontrol is the uncertainty in H0 from the control dataset and N = 200 is the number of realizations. We find no evidence for bias in the inferred value of H0 stemming from substructure that is not modeled in cosmographic inferences.
Current usage metrics show cumulative count of Article Views (full-text article views including HTML views, PDF and ePub downloads, according to the available data) and Abstracts Views on Vision4Press platform.
Data correspond to usage on the plateform after 2015. The current usage metrics is available 48-96 hours after online publication and is updated daily on week days.
Initial download of the metrics may take a while.