Fig. 3.
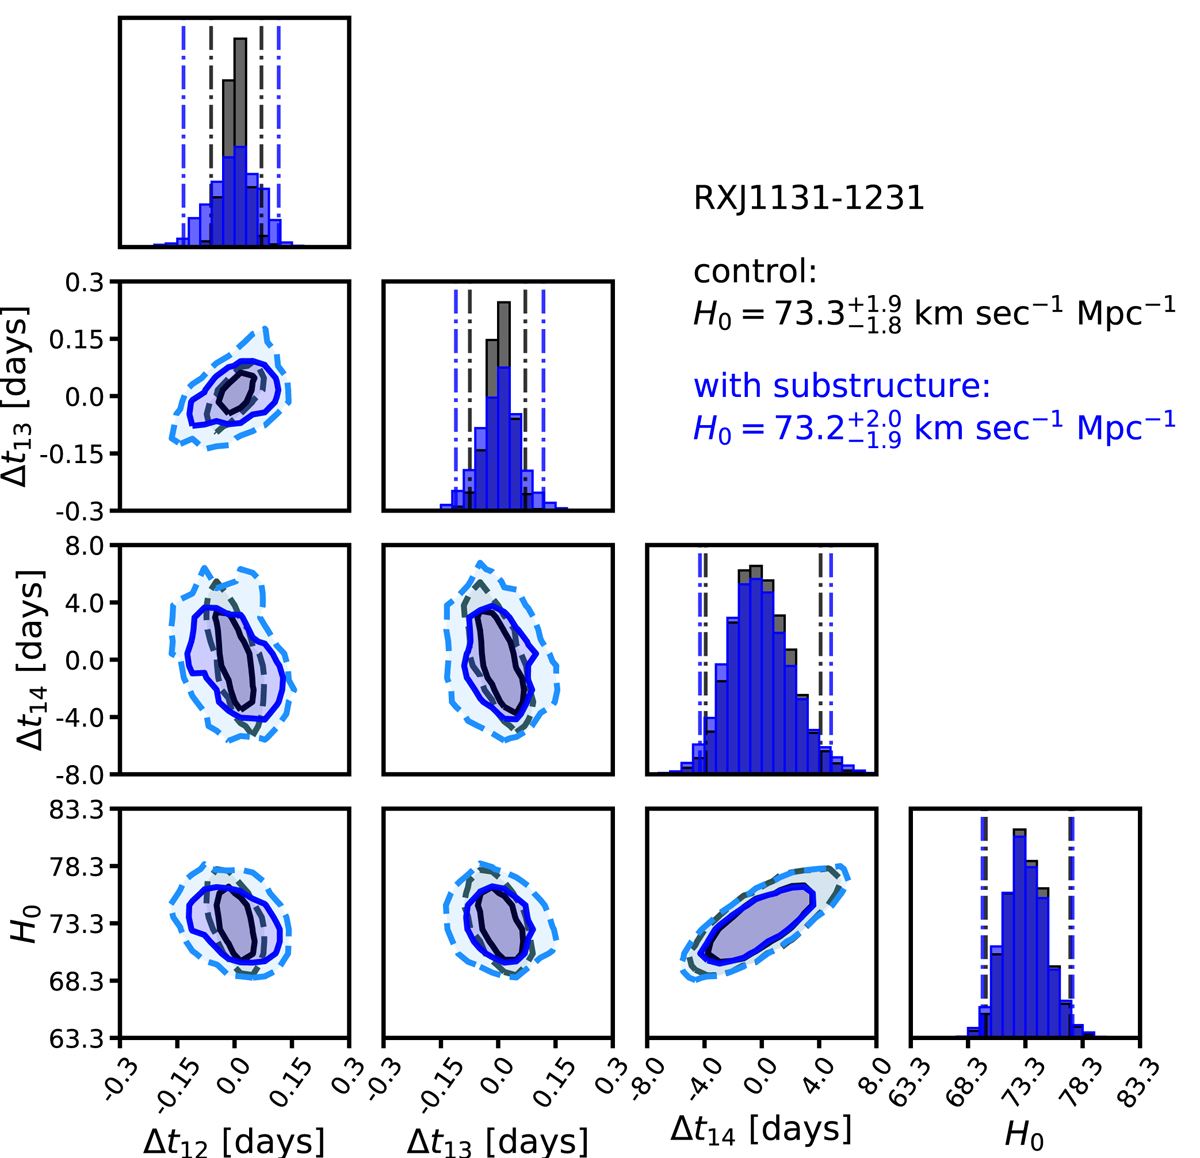
The joint posterior distribution of the residual time delays Δt, defined as the model-predicted time delay minus the true time delay, and the Hubble constant, computed for the lens system RXJ1131−1231. The contours show the 68% and 95% confidence intervals for the control posterior that includes no substructure (black), and the combined posteriors from the inferences on lens models that include substructure (blue). Dashed lines in the histograms show 95% confidence intervals. The median and 68% confidence intervals of the H0 inference are printed above the figure.
Current usage metrics show cumulative count of Article Views (full-text article views including HTML views, PDF and ePub downloads, according to the available data) and Abstracts Views on Vision4Press platform.
Data correspond to usage on the plateform after 2015. The current usage metrics is available 48-96 hours after online publication and is updated daily on week days.
Initial download of the metrics may take a while.