Free Access
Fig. 2.
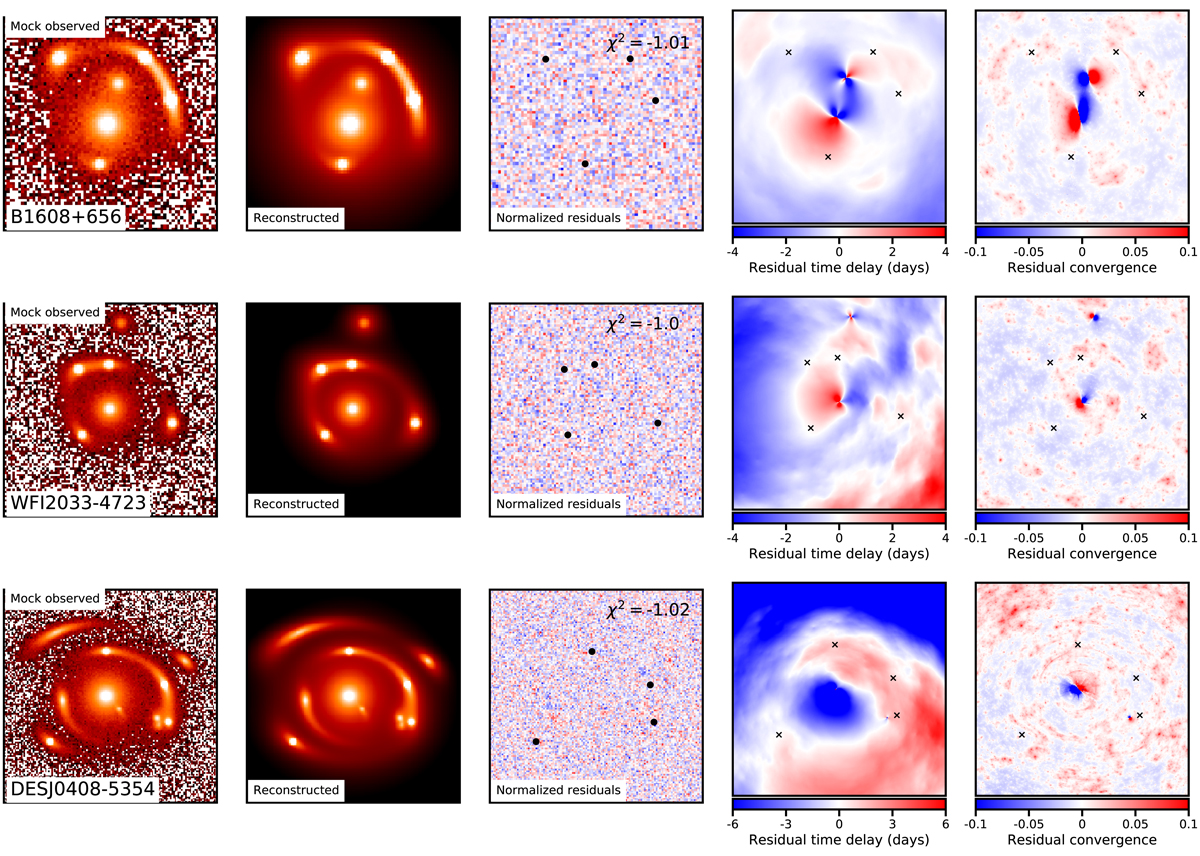
The figure is the same as Fig. 1, but shows examples of the mock observed and reconstructed lens (left), the imaging residuals (center), the residual time delay surface (second from right), and the residual convergence (far right) maps for the lens systems B1608+656, WFI2033−4723, and DESJ0408−5354.
Current usage metrics show cumulative count of Article Views (full-text article views including HTML views, PDF and ePub downloads, according to the available data) and Abstracts Views on Vision4Press platform.
Data correspond to usage on the plateform after 2015. The current usage metrics is available 48-96 hours after online publication and is updated daily on week days.
Initial download of the metrics may take a while.