Fig. 10.
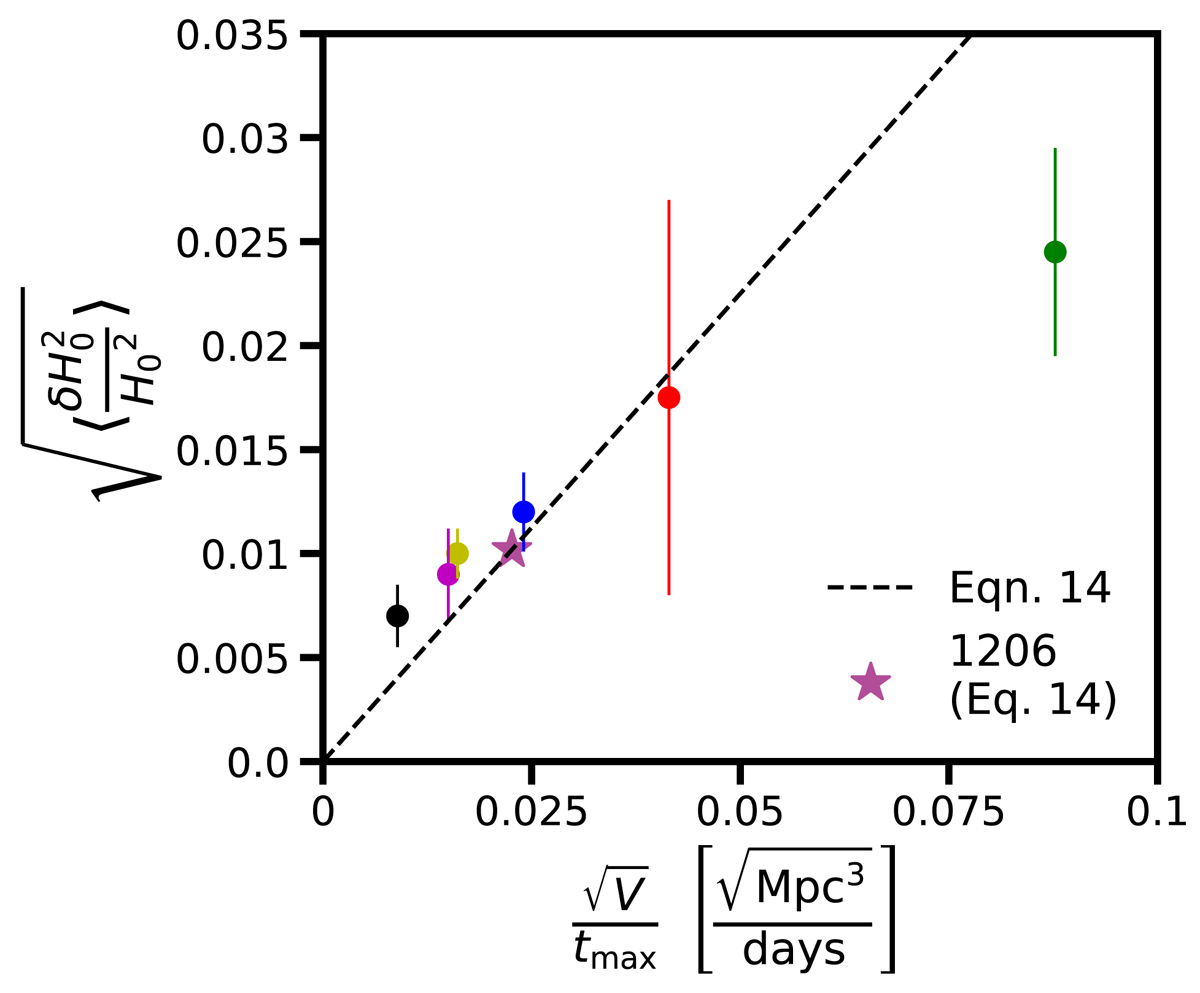
Root mean square fractional uncertainty in H0 (y-axis) is plotted as a function of the number of halos divided by the longest time delay, which is proportional to the lensing volume divided by the longest time delay (x-axis). The color labeling of the points is the same as in Fig. 9. The points show the fractional uncertainty for each of the six systems analyzed in this work, and error bars show the 68% bootstrap confidence intervals. The dashed line shows the fitting function given by Eq. (14). We use the fitting function in Eq. (14) to estimate the contribution of substructure to the uncertainty in H0 for the lens system SDSS 1206+4332 (purple star).
Current usage metrics show cumulative count of Article Views (full-text article views including HTML views, PDF and ePub downloads, according to the available data) and Abstracts Views on Vision4Press platform.
Data correspond to usage on the plateform after 2015. The current usage metrics is available 48-96 hours after online publication and is updated daily on week days.
Initial download of the metrics may take a while.