Fig. 1.
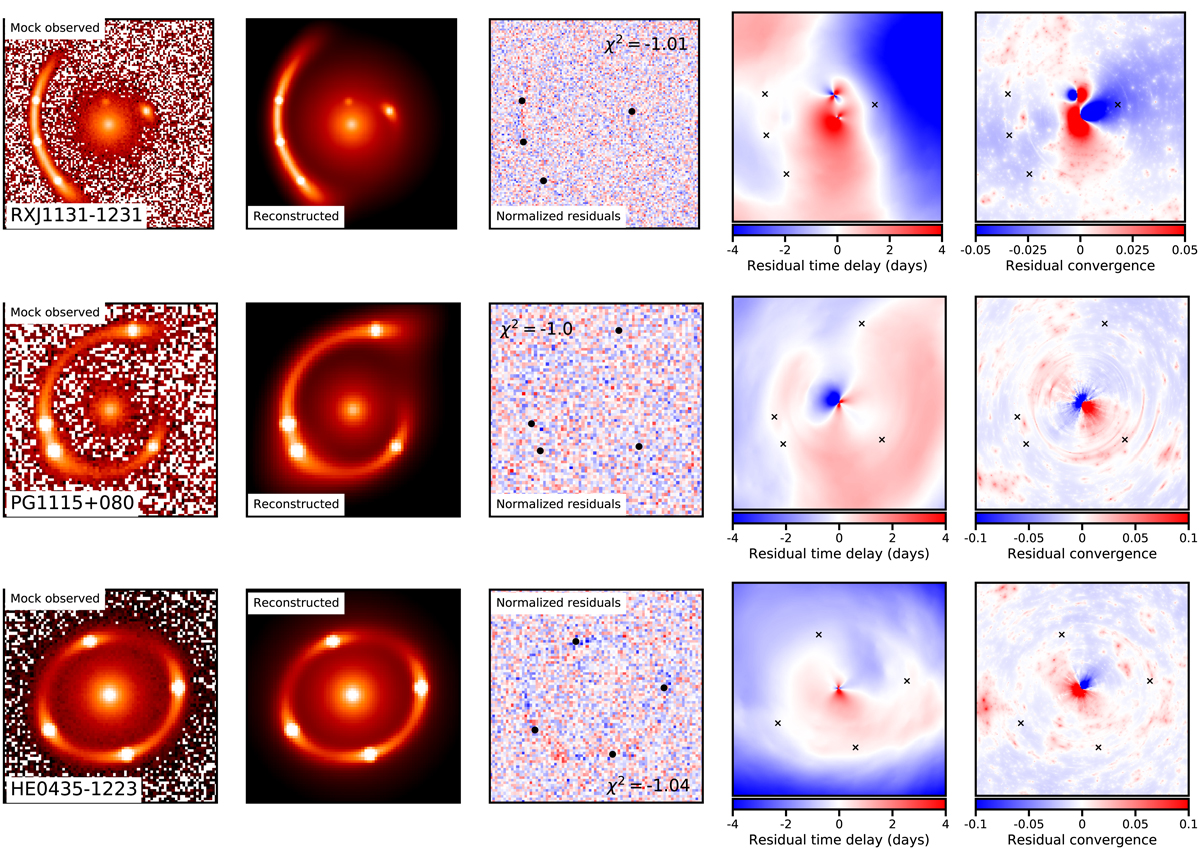
Mock observed lens that includes substructure in the lens model (far left), the reconstructed lensed image (second from left), the normalized imaging residuals (center), the residual time delay surface (second from right), and the residual convergence (far right). The residual time delay surface is the true time delay surface from the mock lens minus the model-predicted time delay surface from the lens model fit to the data. Similarly, the residual convergence is the full multi plane convergence (Eq. (10)) minus the convergence from the model fit to the mock data. The lensed quasar image positions are marked as points (crosses) in the center (right) panels. Each row corresponds to one substructure-perturbed dataset for the lens systems based on RXJ1131−1231, PG1115+080, and HE0435−1223.
Current usage metrics show cumulative count of Article Views (full-text article views including HTML views, PDF and ePub downloads, according to the available data) and Abstracts Views on Vision4Press platform.
Data correspond to usage on the plateform after 2015. The current usage metrics is available 48-96 hours after online publication and is updated daily on week days.
Initial download of the metrics may take a while.