Fig. 7
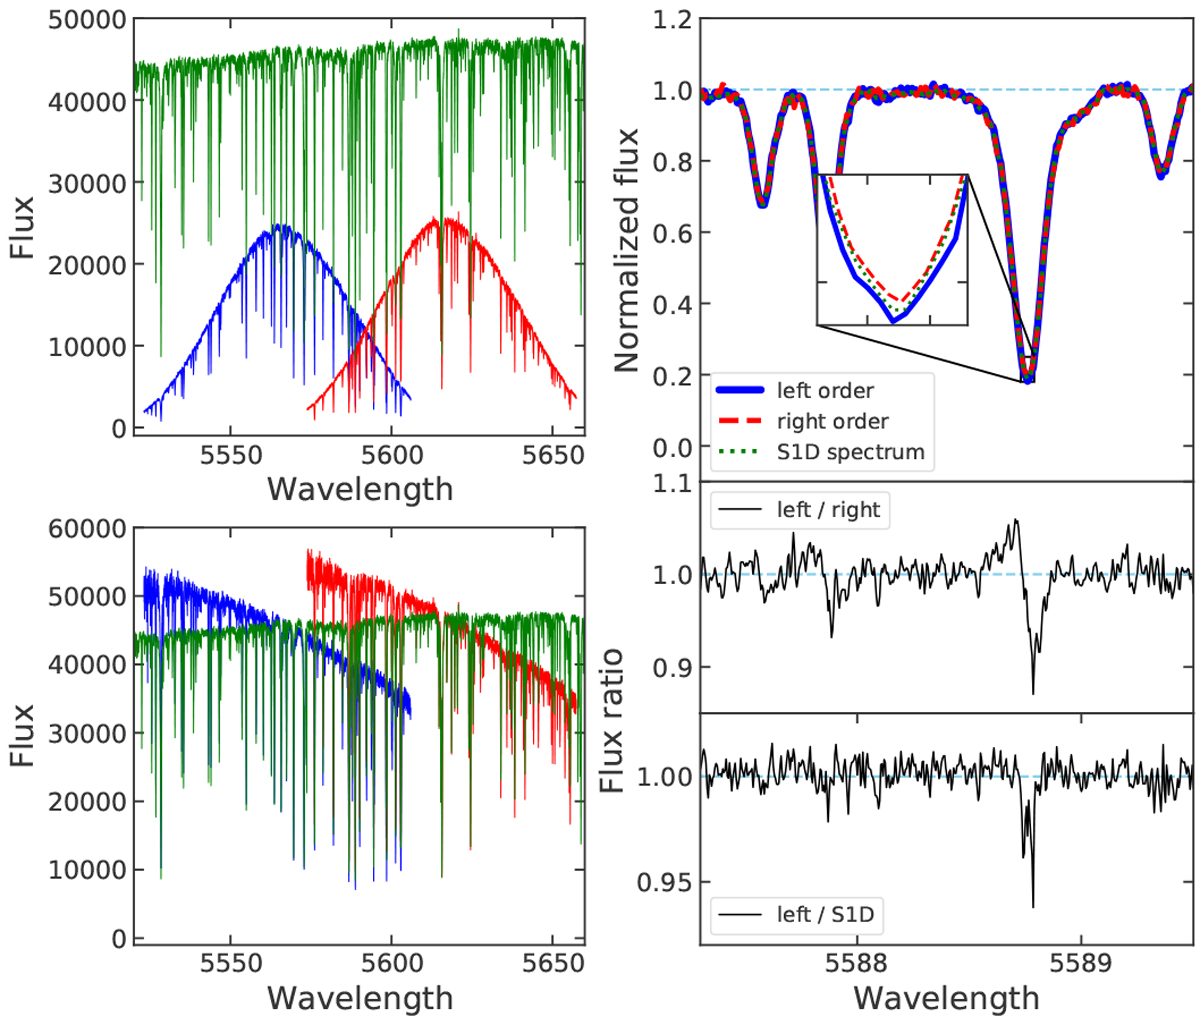
Comparison of S1D spectrum with two ESPRESSO echelle orders before (top left panel) and after (bottom left panel) blaze correction. Top right panel: compares the normalized S1D spectrum with the normalized S2D adjacent orders for a small spectral region in which the two orders overlap. The inset plot shows the zoom of the core of the strongest spectral linein the region. Middle-right and bottom-right panels: division of the two orders and the division of the left order by theS1D spectrum, respectively.
Current usage metrics show cumulative count of Article Views (full-text article views including HTML views, PDF and ePub downloads, according to the available data) and Abstracts Views on Vision4Press platform.
Data correspond to usage on the plateform after 2015. The current usage metrics is available 48-96 hours after online publication and is updated daily on week days.
Initial download of the metrics may take a while.