Fig. 5
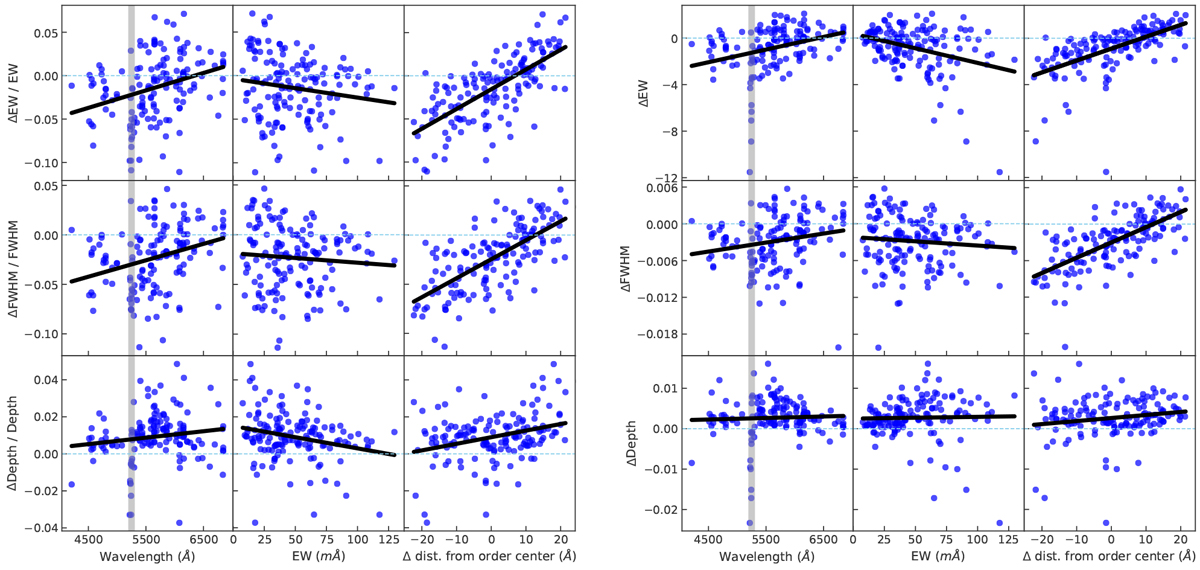
Relative (left panel) and absolute (right panel) differences of spectral line parameters measuredin different ESPRESSO echelle orders as a function of wavelength, EW, and the distance from the center of the spectral order. The boundary wavelength region (at ~5250 Å) of the blue- and red-arm detectors is indicated by a gray rectangle. Line properties have been measured with ARES with a fixed S/N for each order. The linear regression of the data is shown as black lines.
Current usage metrics show cumulative count of Article Views (full-text article views including HTML views, PDF and ePub downloads, according to the available data) and Abstracts Views on Vision4Press platform.
Data correspond to usage on the plateform after 2015. The current usage metrics is available 48-96 hours after online publication and is updated daily on week days.
Initial download of the metrics may take a while.