Fig. 3
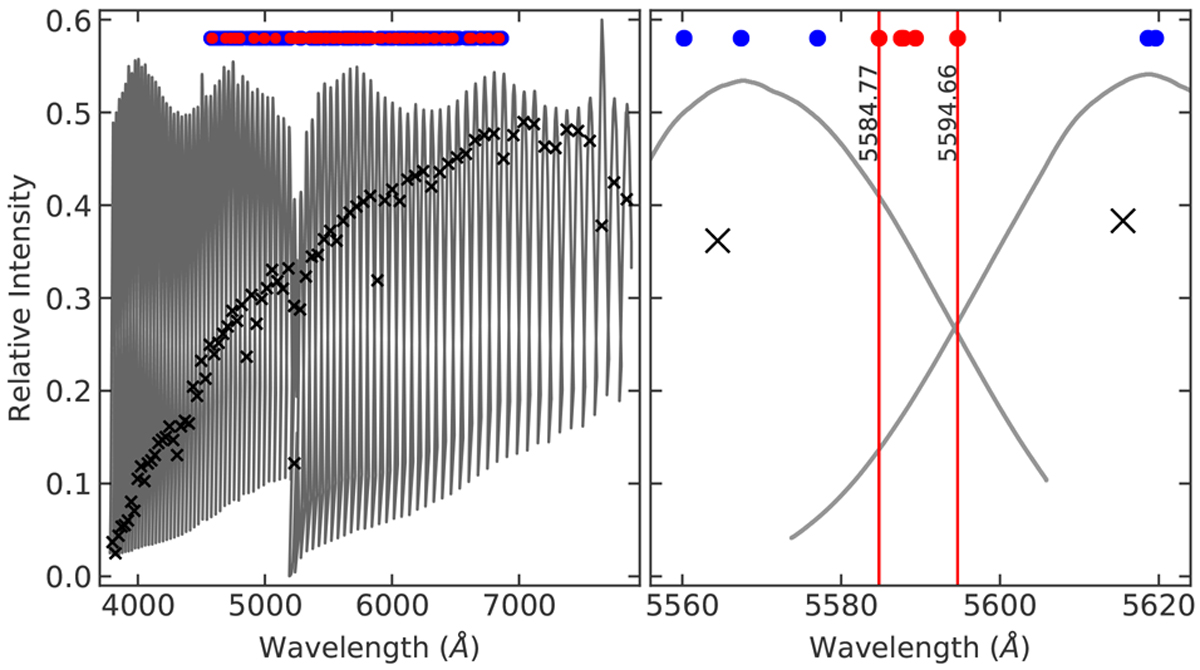
Left panel: spectral response (blaze function, black curve) for the ESPRESSO echelle orders for one of the solar spectra. The black crosses show the center of each order, and their ordinate values indicate the maximum S/N of the orders divided by 400 (for the sake of visibility). Blue and red circles indicate the wavelength of spectral lines that appear in single and multiple echelle orders, respectively. The two vertical red lines indicate the two spectral lines discussed in the text. Right panel: zoom of the left panel for two adjacent spectral orders.
Current usage metrics show cumulative count of Article Views (full-text article views including HTML views, PDF and ePub downloads, according to the available data) and Abstracts Views on Vision4Press platform.
Data correspond to usage on the plateform after 2015. The current usage metrics is available 48-96 hours after online publication and is updated daily on week days.
Initial download of the metrics may take a while.