Fig. C.1
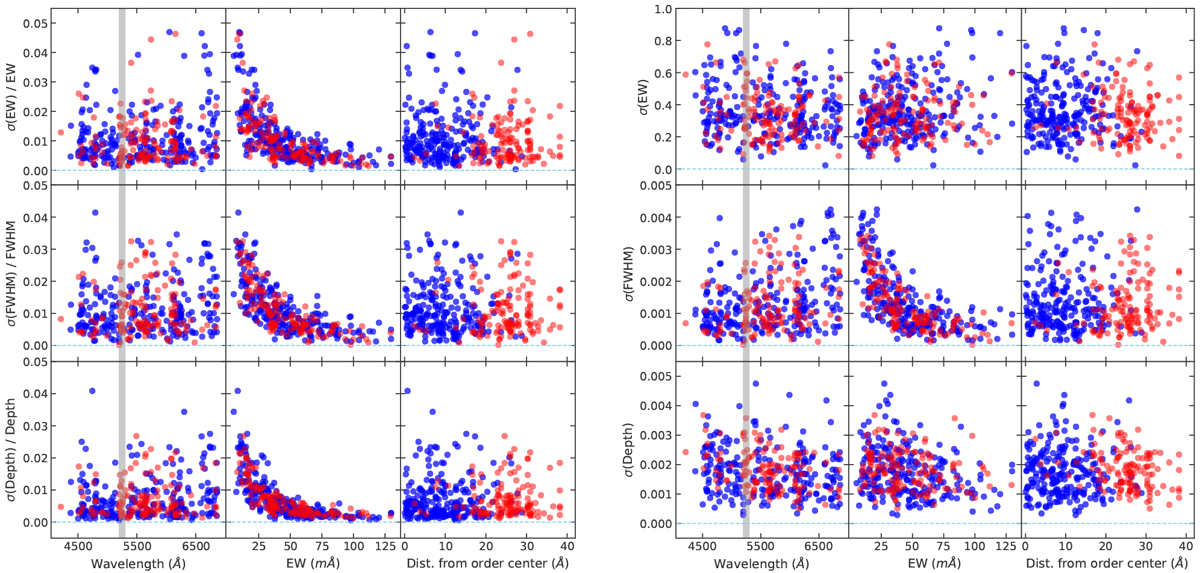
Relative (left panel) and absolute (right panel) spectrum-to-spectrum scatter of spectral line parametersmeasured from five 1D solar spectra as a function of wavelength, EW, and the distance from the center of the spectral order. The red and blue symbols correspond to the lines that in the 2D spectrum are observed in multiple and single orders, respectively. The boundary wavelength region (at ~5250 Å) of the blue- and red-arm detectors is indicated by the rectangle.
Current usage metrics show cumulative count of Article Views (full-text article views including HTML views, PDF and ePub downloads, according to the available data) and Abstracts Views on Vision4Press platform.
Data correspond to usage on the plateform after 2015. The current usage metrics is available 48-96 hours after online publication and is updated daily on week days.
Initial download of the metrics may take a while.