Free Access
Fig. 14
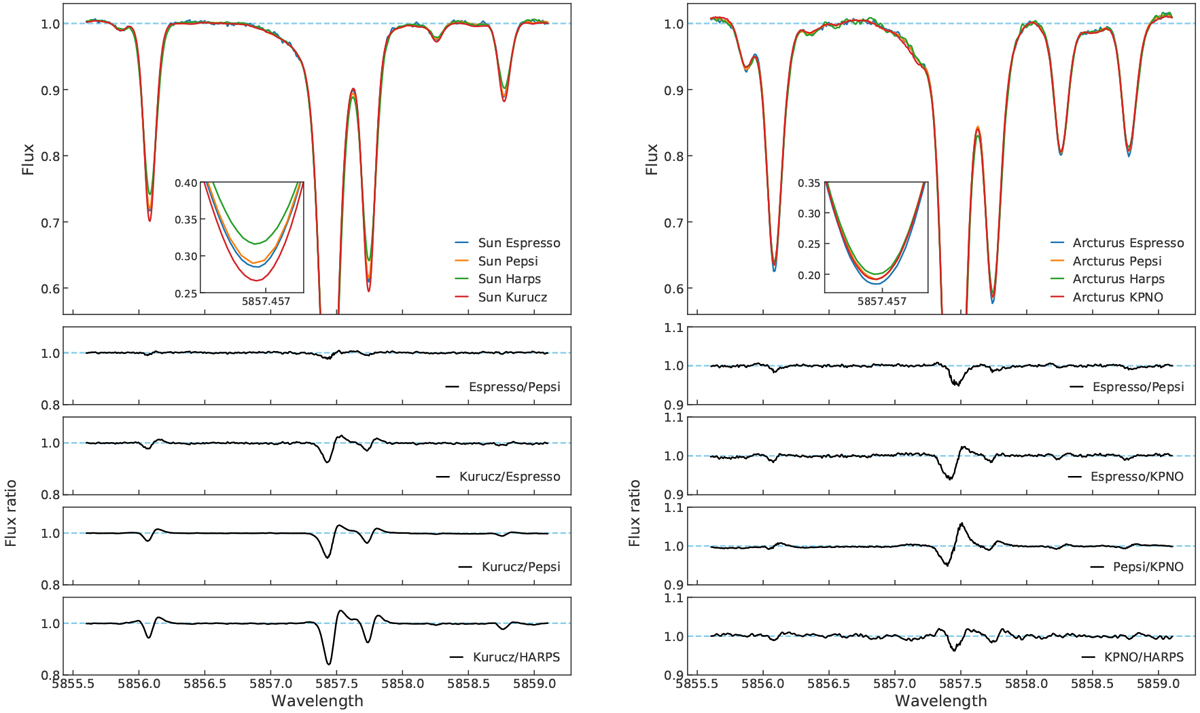
Comparison of the ESPRESSO, PEPSI, and HARPS spectra of the Sun and Arcturus with the Kurucz solar atlas from Kurucz (2005) and the KPNO Arcturus atlas from Hinkle et al. (2000). The inset graphs show the core of the close-by strong lines. Four bottom panels: ratio of the aforementioned spectra.
Current usage metrics show cumulative count of Article Views (full-text article views including HTML views, PDF and ePub downloads, according to the available data) and Abstracts Views on Vision4Press platform.
Data correspond to usage on the plateform after 2015. The current usage metrics is available 48-96 hours after online publication and is updated daily on week days.
Initial download of the metrics may take a while.