Free Access
Fig. 10
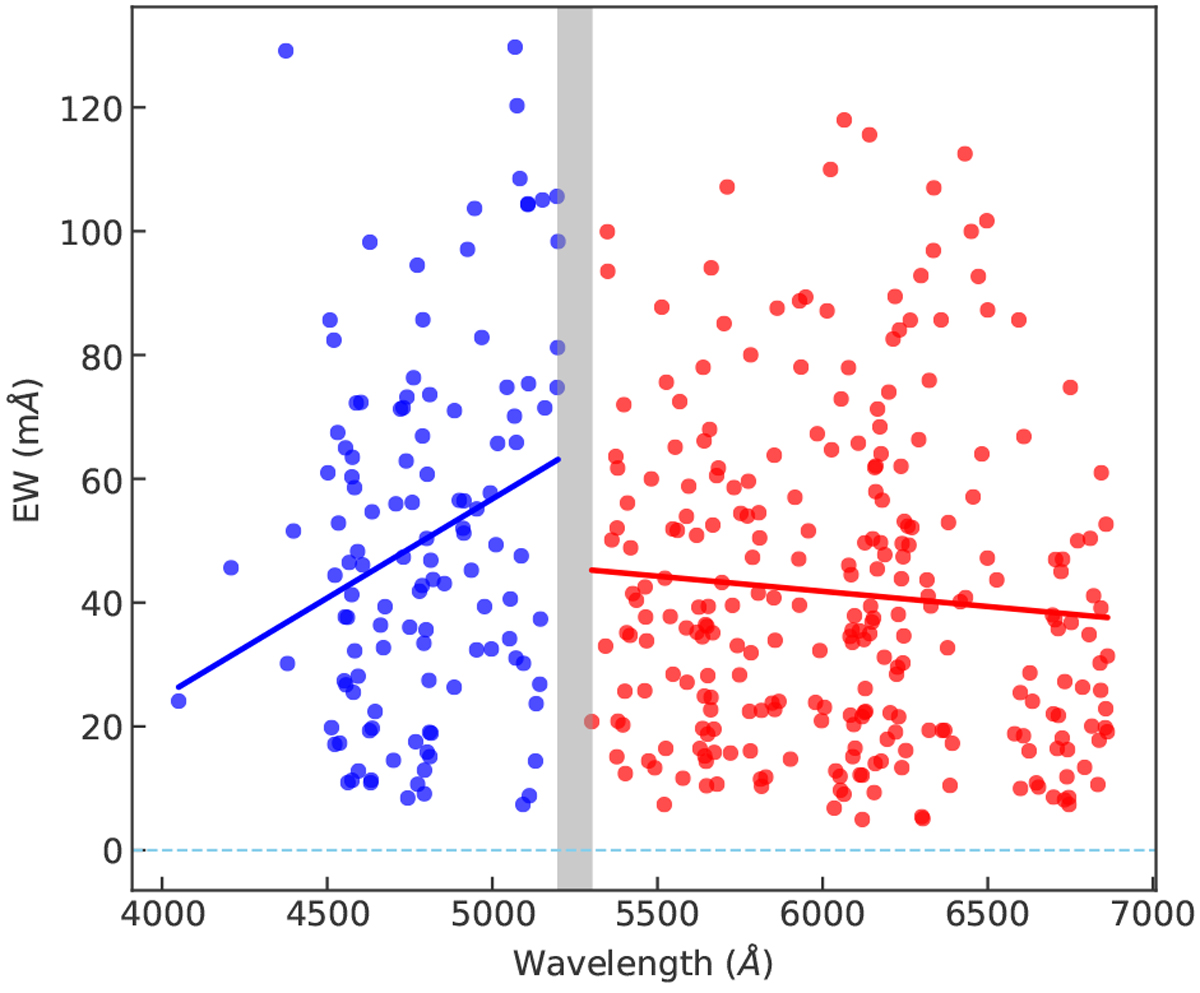
Equivalent width of spectral lines measured from S1D spectra as a function of wavelength. Spectral lines in the blue- and red-arms of the spectrograph are represented by blue and red symbols, respectively. The results of linear regression for the two sets of lines are shown as solid blue and red lines.
Current usage metrics show cumulative count of Article Views (full-text article views including HTML views, PDF and ePub downloads, according to the available data) and Abstracts Views on Vision4Press platform.
Data correspond to usage on the plateform after 2015. The current usage metrics is available 48-96 hours after online publication and is updated daily on week days.
Initial download of the metrics may take a while.