Fig. 4.
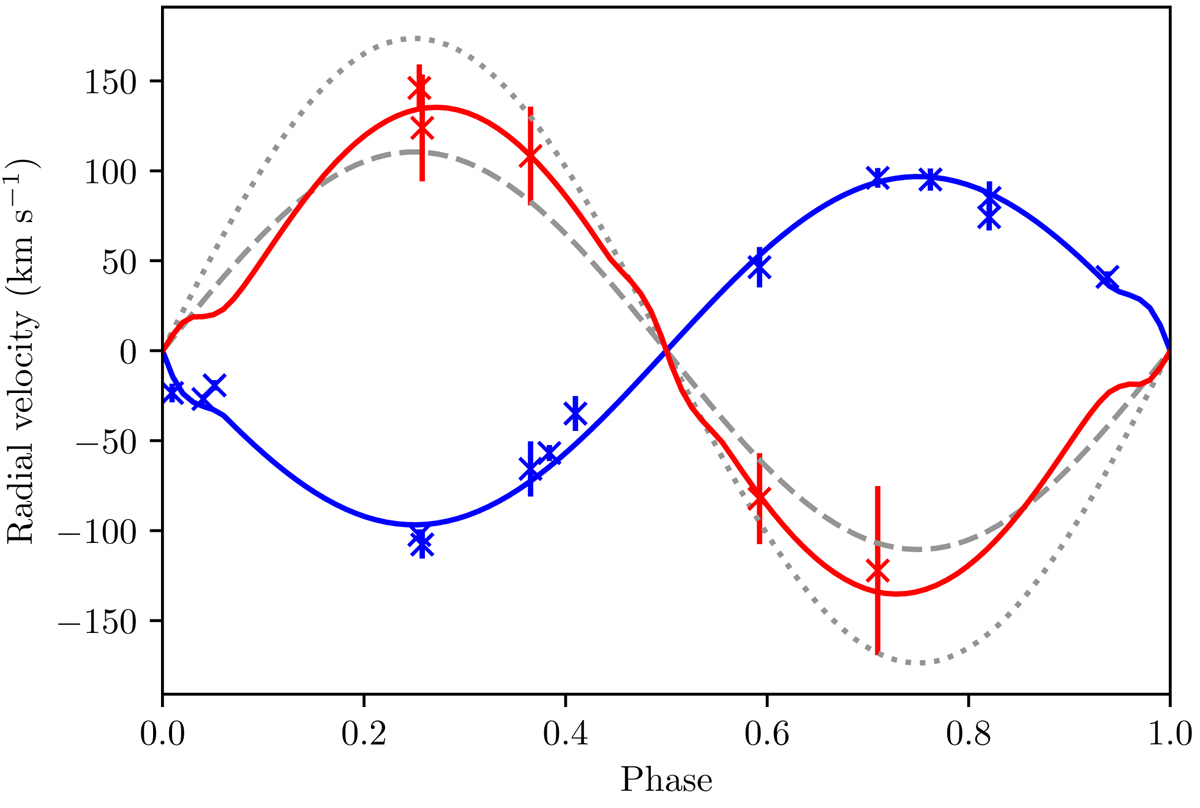
Phase-folded RVs of the hot (blue) and cool (red) components of the central star system of PN G283.7−05.1, overlaid on the best-fitting PHOEBE2 model RV curves. The centre-of-mass RV curve of the secondary is shown as the dotted grey line, while the RV of its innermost point (i.e. the most highly irradiated part of the stellar surface) is shown as the dashed grey line.
Current usage metrics show cumulative count of Article Views (full-text article views including HTML views, PDF and ePub downloads, according to the available data) and Abstracts Views on Vision4Press platform.
Data correspond to usage on the plateform after 2015. The current usage metrics is available 48-96 hours after online publication and is updated daily on week days.
Initial download of the metrics may take a while.