Fig. 4
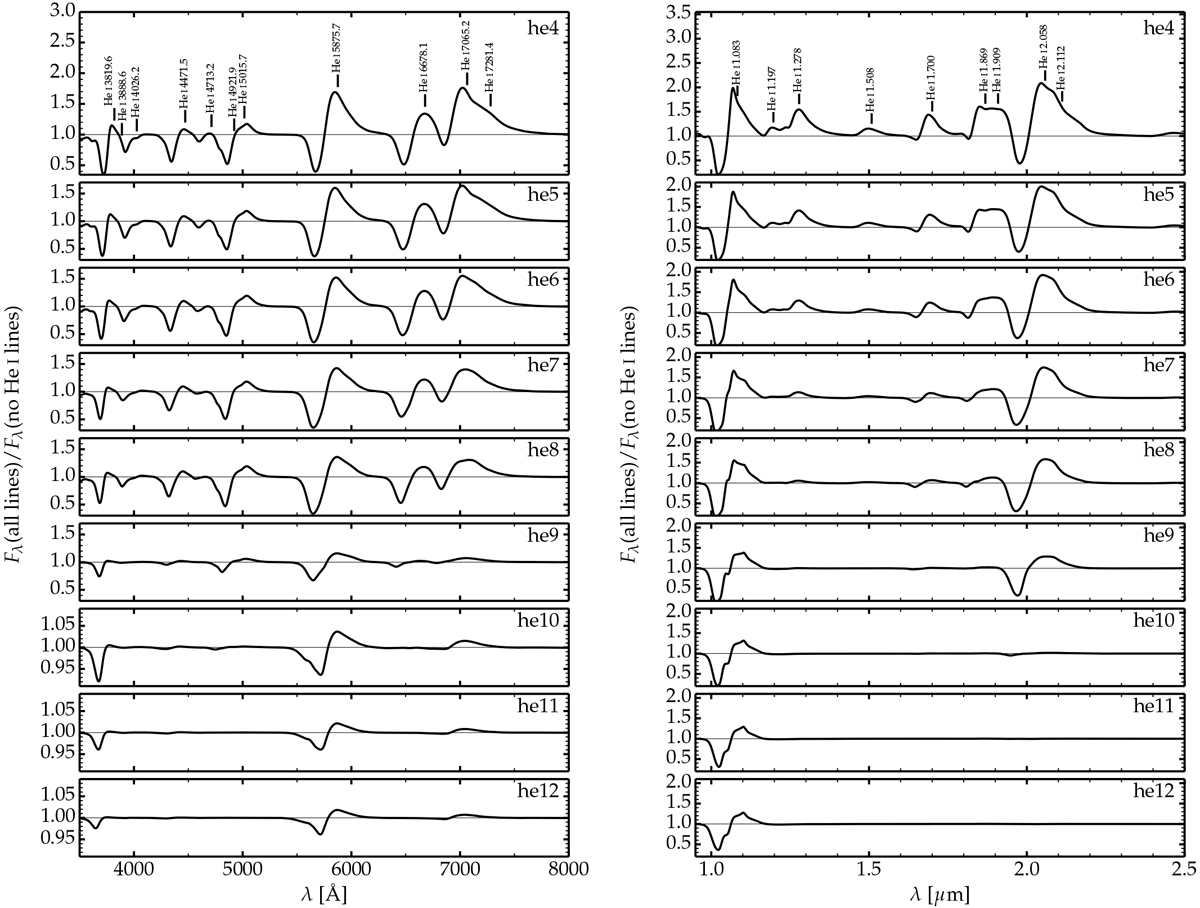
Illustration of the He I lines in our model sequence he4–he12 at bolometric maximum. The quantity shown is the ratio of the total flux (i.e., computed by accounting for all bound-bound transitions of all species) with the flux obtained by excluding He I bound-bound transitions. In models he4 to he8, He I lines are not limited to 5876, 6678, and 7065 Å but are instead present throughout the optical up to 7281.4 Å. Their strength diminishes as we progress from model he4 to he8, and progressively vanish as we progress from model he9 to he12. The ordinate scale is not kept the same for all panels, to better reveal the strong variation in the strength of He I lines between models. While He I optical lines stand 30 to 60% above the continuum in models he4–he8, their strength is at the 1% level in models he10–he12 (such weak lines are hard to detect without high S/N).
Current usage metrics show cumulative count of Article Views (full-text article views including HTML views, PDF and ePub downloads, according to the available data) and Abstracts Views on Vision4Press platform.
Data correspond to usage on the plateform after 2015. The current usage metrics is available 48-96 hours after online publication and is updated daily on week days.
Initial download of the metrics may take a while.