Fig. 3
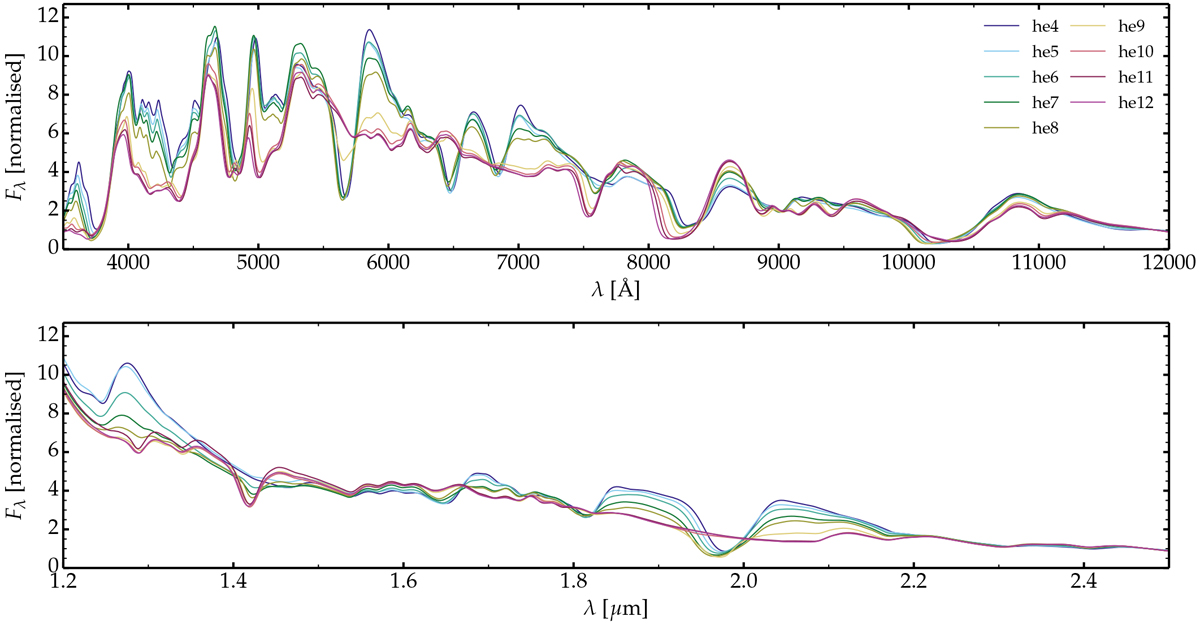
Comparison of the optical (top) and near-infrared (bottom) spectra at bolometric maximum for the He-star explosion models he4–he12. There is a clear separation between models that show He I lines (at 5876, 6678, 7065, 10 830, 20 581 Å) and those that do not. Model he9 is an intermediate case. The presence or absence of He I lines is easy to see in the optical. He I 10830 Å overlaps with O and Mg lines so a feature is seen in this spectral region irrespective of the He content. He I 20 581 Å gives a clear signature. We also note that all models have about the same color at maximum (modulo the strength of lines). For He I line identifications, see Fig. 4.
Current usage metrics show cumulative count of Article Views (full-text article views including HTML views, PDF and ePub downloads, according to the available data) and Abstracts Views on Vision4Press platform.
Data correspond to usage on the plateform after 2015. The current usage metrics is available 48-96 hours after online publication and is updated daily on week days.
Initial download of the metrics may take a while.