Fig. B.2
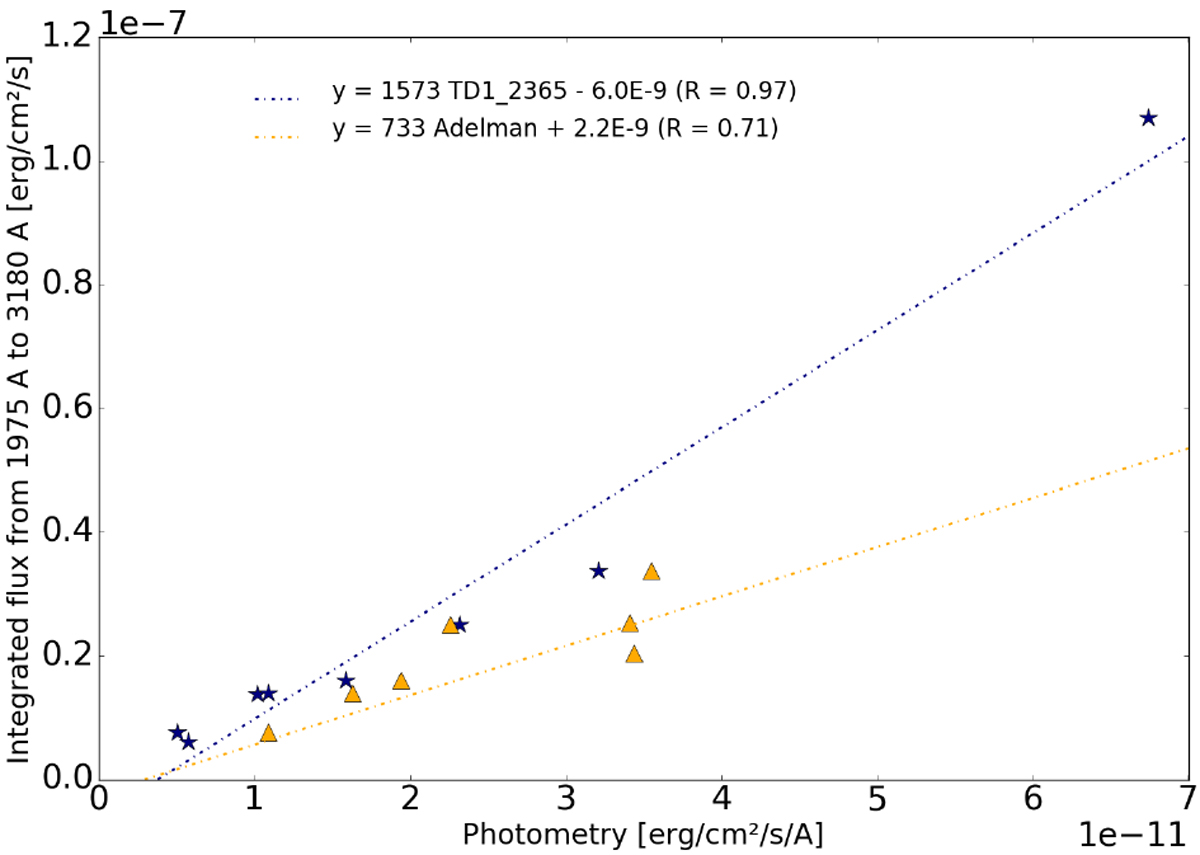
Integrated flux over [1975 Å; 3180 Å] based on INES spectra as a function of TD1 flux at 2365 Å (blue stars) and of Adelman constant flux (orange triangles). The dash-dotted lines display the best linear laws for each dataset with the corresponding equations and regression coefficients at the top.
Current usage metrics show cumulative count of Article Views (full-text article views including HTML views, PDF and ePub downloads, according to the available data) and Abstracts Views on Vision4Press platform.
Data correspond to usage on the plateform after 2015. The current usage metrics is available 48-96 hours after online publication and is updated daily on week days.
Initial download of the metrics may take a while.