Fig. 5
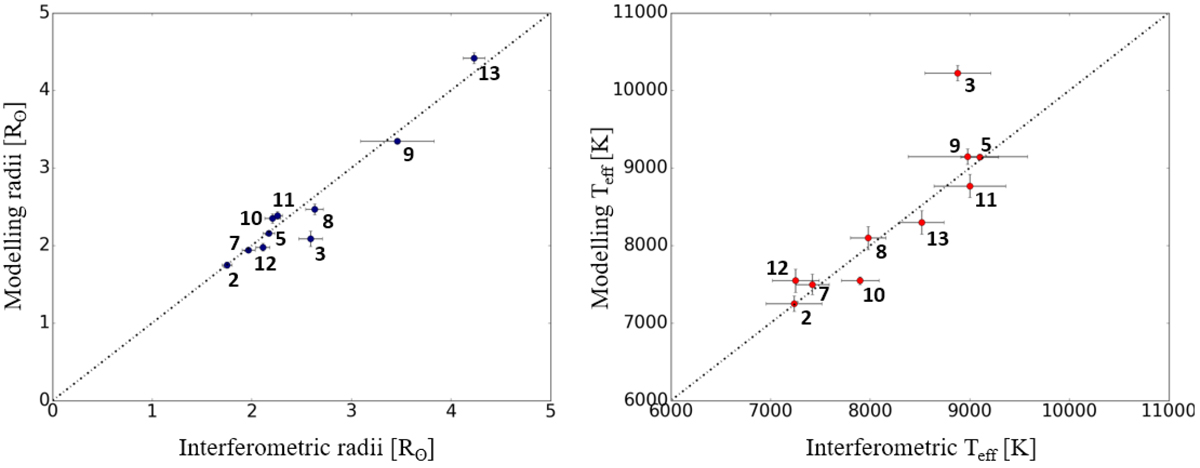
Comparison between the radii (left) and the effective temperatures (right) derived from interferometric measurements and those derived from the self-consistent spectroscopic modelling. The dash lines give the 1:1 relations. The numbers close to the symbols refer to Table 4.
Current usage metrics show cumulative count of Article Views (full-text article views including HTML views, PDF and ePub downloads, according to the available data) and Abstracts Views on Vision4Press platform.
Data correspond to usage on the plateform after 2015. The current usage metrics is available 48-96 hours after online publication and is updated daily on week days.
Initial download of the metrics may take a while.