Fig. 1
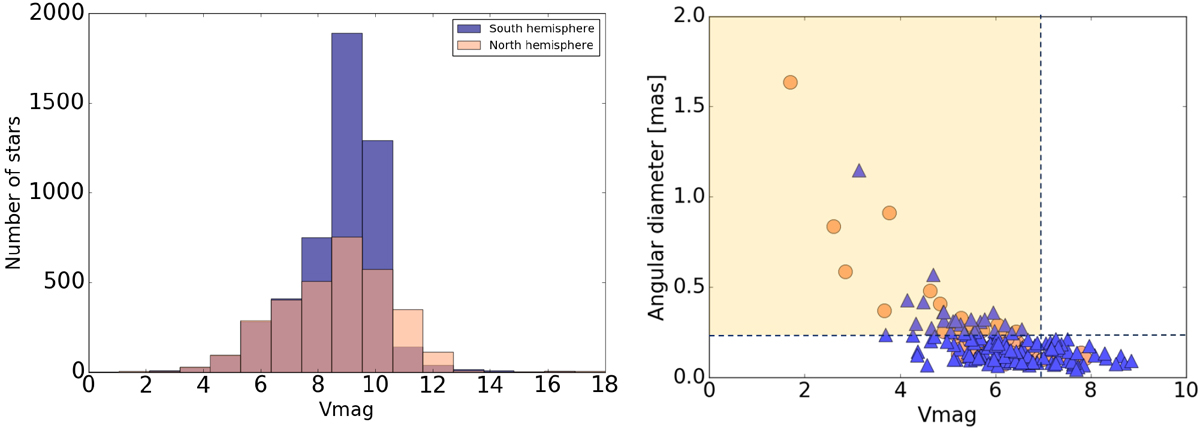
Left: Vmag histograms of the Renson targets (Renson & Manfroid 2009) for the southern and northern hemispheres. Right: expected angular diameter as a function of the brightest Ap stars of the northern (orange circles) and southern (blue triangles) hemispheres. The yellow area corresponds to the sensitivity and the angular resolution of the visible instrumentations of the CHARA array.
Current usage metrics show cumulative count of Article Views (full-text article views including HTML views, PDF and ePub downloads, according to the available data) and Abstracts Views on Vision4Press platform.
Data correspond to usage on the plateform after 2015. The current usage metrics is available 48-96 hours after online publication and is updated daily on week days.
Initial download of the metrics may take a while.