Fig. C.1.
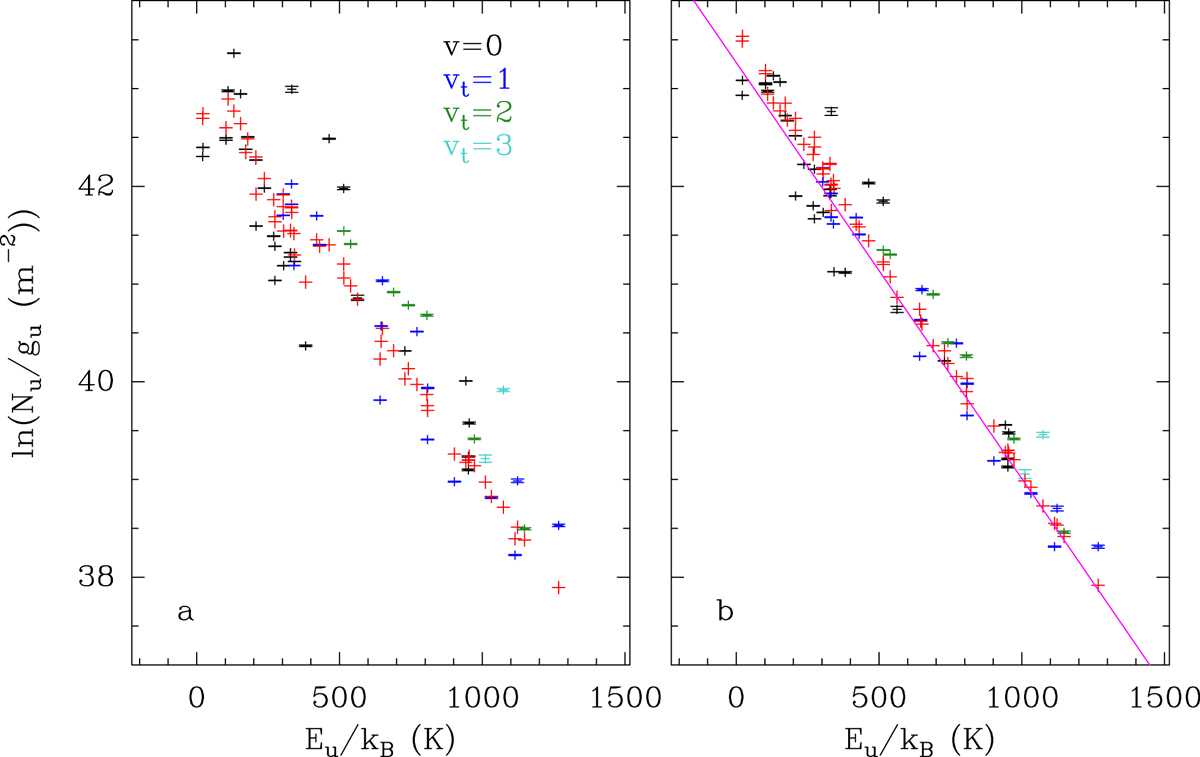
Population diagram of CH3OH toward Sgr B2(N1S). The observed data points are shown in various colors (but not red), as indicated in the upper right corner of panel a, and the synthetic populations are shown in red. No correction is applied in panel a. In panel b, the optical depth correction has been applied to both the observed and synthetic populations, and the contamination by all other species included in the full model has been removed from the observed data points. The purple line is a linear fit to the observed populations (in linear-logarithmic space).
Current usage metrics show cumulative count of Article Views (full-text article views including HTML views, PDF and ePub downloads, according to the available data) and Abstracts Views on Vision4Press platform.
Data correspond to usage on the plateform after 2015. The current usage metrics is available 48-96 hours after online publication and is updated daily on week days.
Initial download of the metrics may take a while.