Fig. 1.
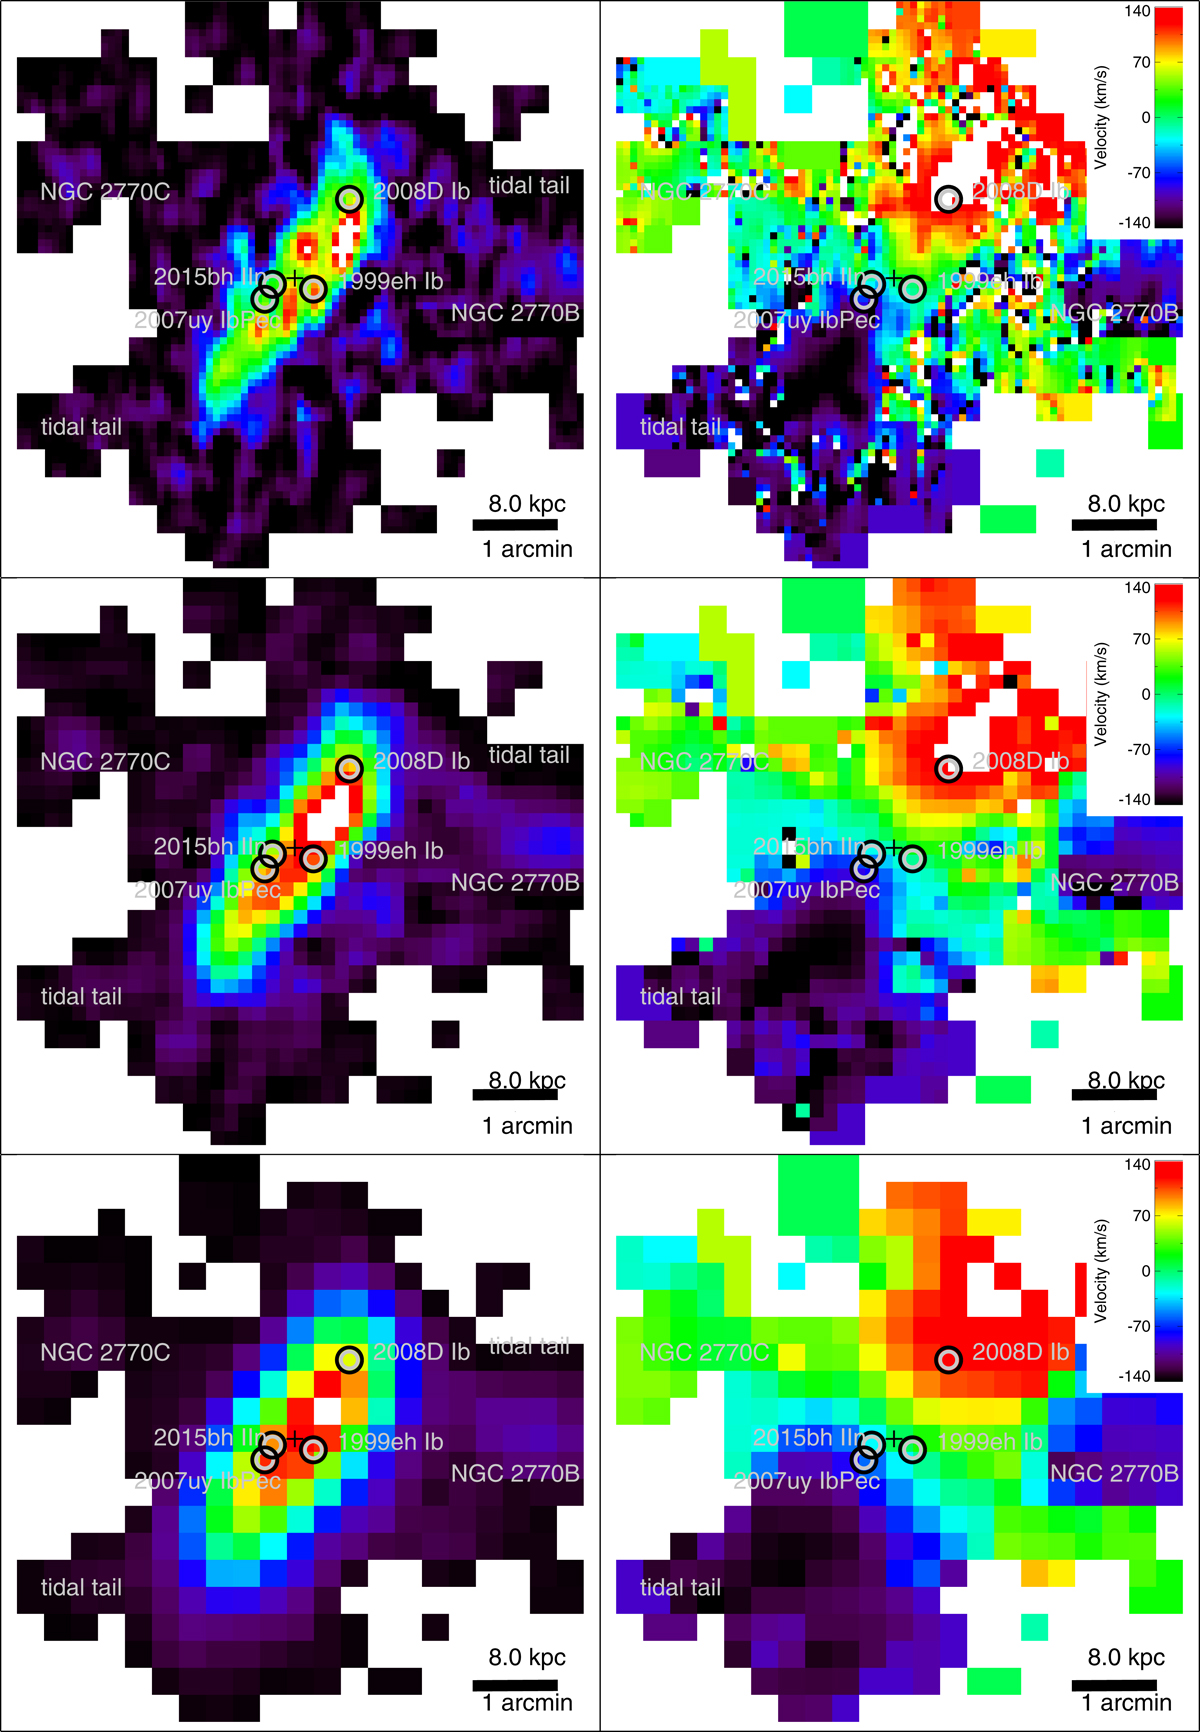
Atomic gas distribution in NGC 2770. The data are at resolutions of 24″ × 13″ (top), 36″ × 30″ (middle), and 65″ × 56″ (bottom). Left: zeroth moment maps (integrated emission). Right: first moment maps (velocity fields) relative to z = 0.00649 (1945.65 km s−1). The positions of SNe are marked by grey circles, whereas the black cross shows the position of the optical centre of the galaxy. Each panel is 6.7′ per side. North is up and east is to the left. NGC 2770B is at the right edge of the panels and connected to NGC 2770 by a tidal feature. NGC 2770C is at the left edge of the panels.
Current usage metrics show cumulative count of Article Views (full-text article views including HTML views, PDF and ePub downloads, according to the available data) and Abstracts Views on Vision4Press platform.
Data correspond to usage on the plateform after 2015. The current usage metrics is available 48-96 hours after online publication and is updated daily on week days.
Initial download of the metrics may take a while.