Fig. 9.
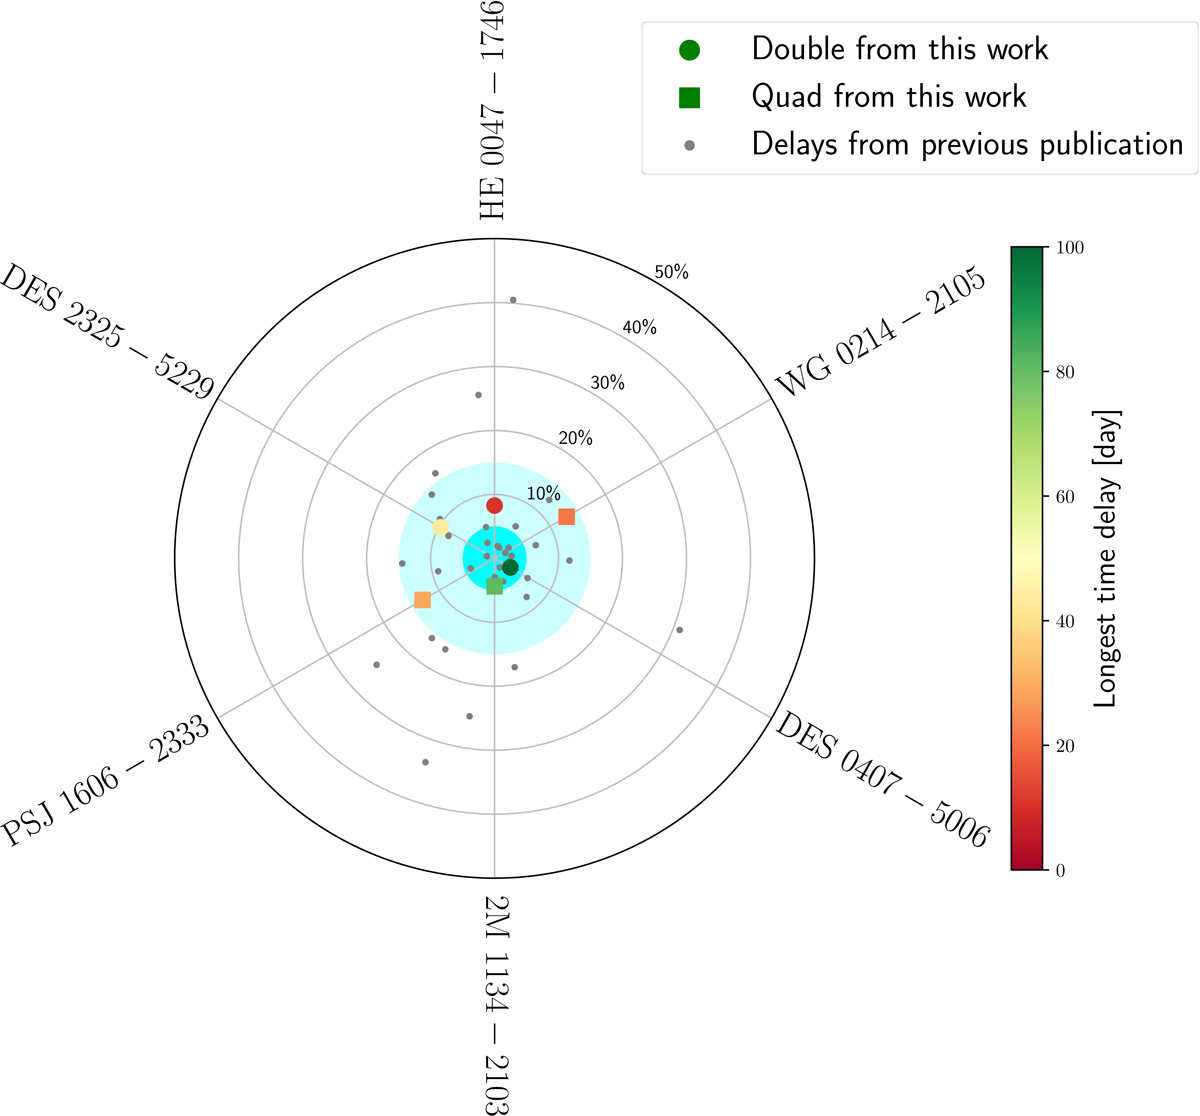
Time-delays relative uncertainties for the object presented in this work (colored dots) and already available in the literature (gray dots) (see Table 3 of Millon et al. 2020, for a list of published time delays). For quadruply imaged quasars, the combined uncertainties between all three independent time delays, corresponding to the minimal uncertainties achievable on H0, are shown under the assumption that the time-delay errors remain the dominant source of uncertainties. The outer light blue circle corresponds to a precision better than 15%. The inner blue circle corresponds to the target region with precision better than 5%, corresponding to the threshold at which the time-delay errors become smaller than other sources of errors in the inference of H0.
Current usage metrics show cumulative count of Article Views (full-text article views including HTML views, PDF and ePub downloads, according to the available data) and Abstracts Views on Vision4Press platform.
Data correspond to usage on the plateform after 2015. The current usage metrics is available 48-96 hours after online publication and is updated daily on week days.
Initial download of the metrics may take a while.