Fig. 4.
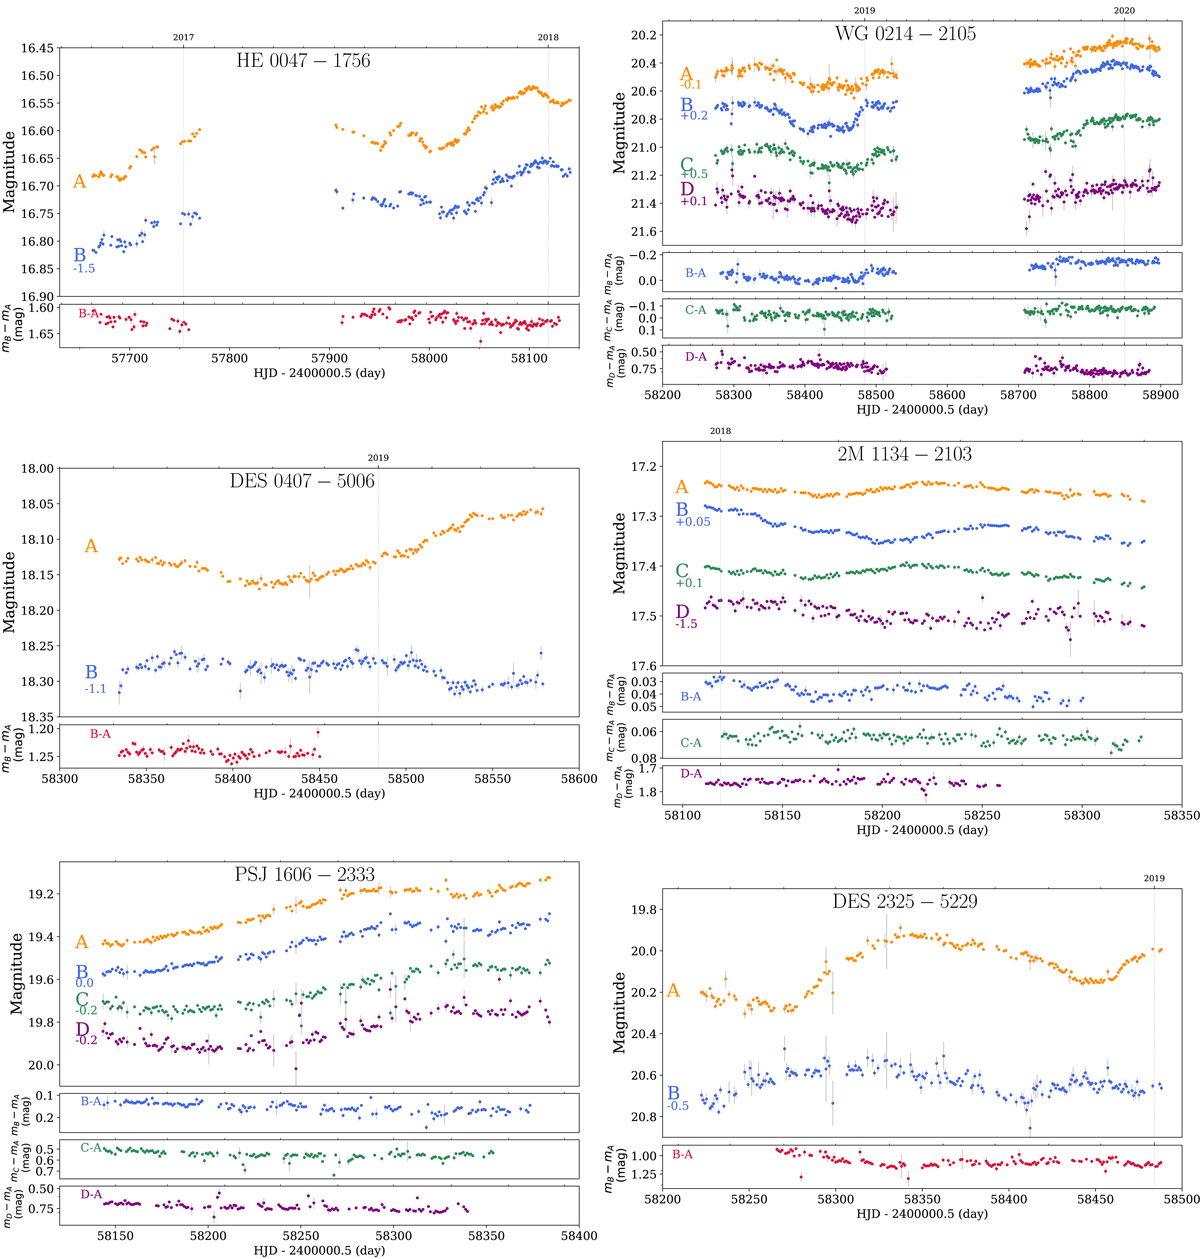
Light curves for the six lensed quasars presented in this paper. The bottom panels of each lens system show the difference curves between pairs of multiple images shifted by the measured time delays, highlighting the extrinsic variations. Spline interpolation between the data points are used to produce the difference curve, which corresponds the magnitude difference between pairs of images after correction for the measured time delay, but no correction for microlensing is applied.
Current usage metrics show cumulative count of Article Views (full-text article views including HTML views, PDF and ePub downloads, according to the available data) and Abstracts Views on Vision4Press platform.
Data correspond to usage on the plateform after 2015. The current usage metrics is available 48-96 hours after online publication and is updated daily on week days.
Initial download of the metrics may take a while.