Free Access
Fig. 8.
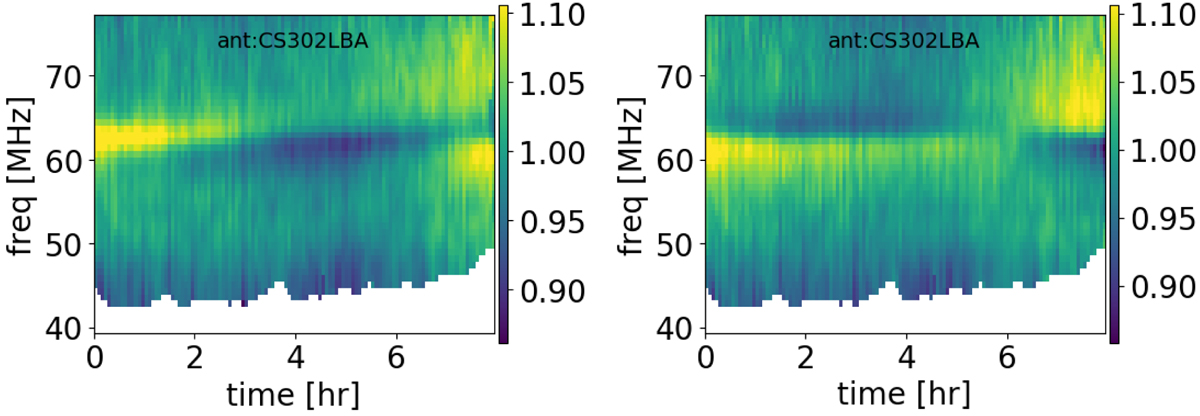
Antenna-averaged normalised amplitude solutions in the direction of Toothbrush cluster plotted as a function of observing time (x-axis) and frequency (y-axis) for the X (left), and Y (right) polarisation. The bandpass has been already removed and here the dominant effects are unmodelled structures in the theoretical beam.
Current usage metrics show cumulative count of Article Views (full-text article views including HTML views, PDF and ePub downloads, according to the available data) and Abstracts Views on Vision4Press platform.
Data correspond to usage on the plateform after 2015. The current usage metrics is available 48-96 hours after online publication and is updated daily on week days.
Initial download of the metrics may take a while.