Free Access
Fig. 3.
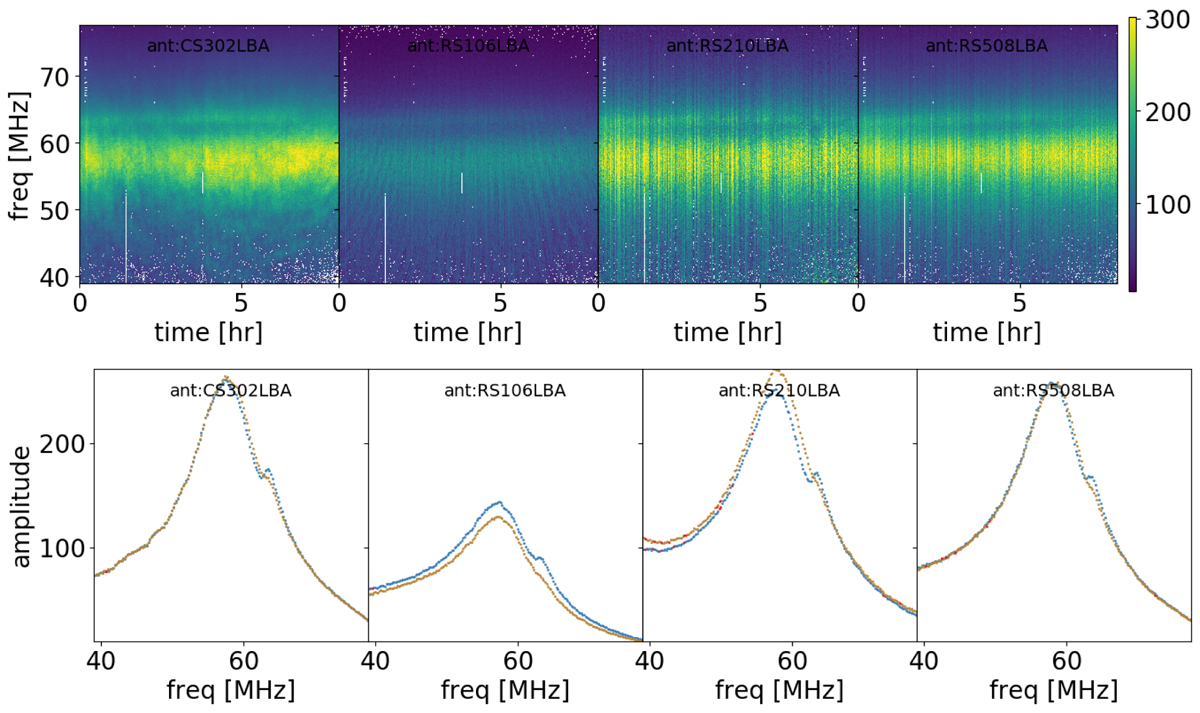
Top panel: amplitude solutions for four different stations (CS302, RS106, RS210, and RS508) plotted as a function of observing time (x-axis) and frequency (y-axis). Bottom panel: time-averaged amplitude solutions that encode the instrument frequency response and that are transferred to the target field.
Current usage metrics show cumulative count of Article Views (full-text article views including HTML views, PDF and ePub downloads, according to the available data) and Abstracts Views on Vision4Press platform.
Data correspond to usage on the plateform after 2015. The current usage metrics is available 48-96 hours after online publication and is updated daily on week days.
Initial download of the metrics may take a while.