Free Access
Fig. 2.
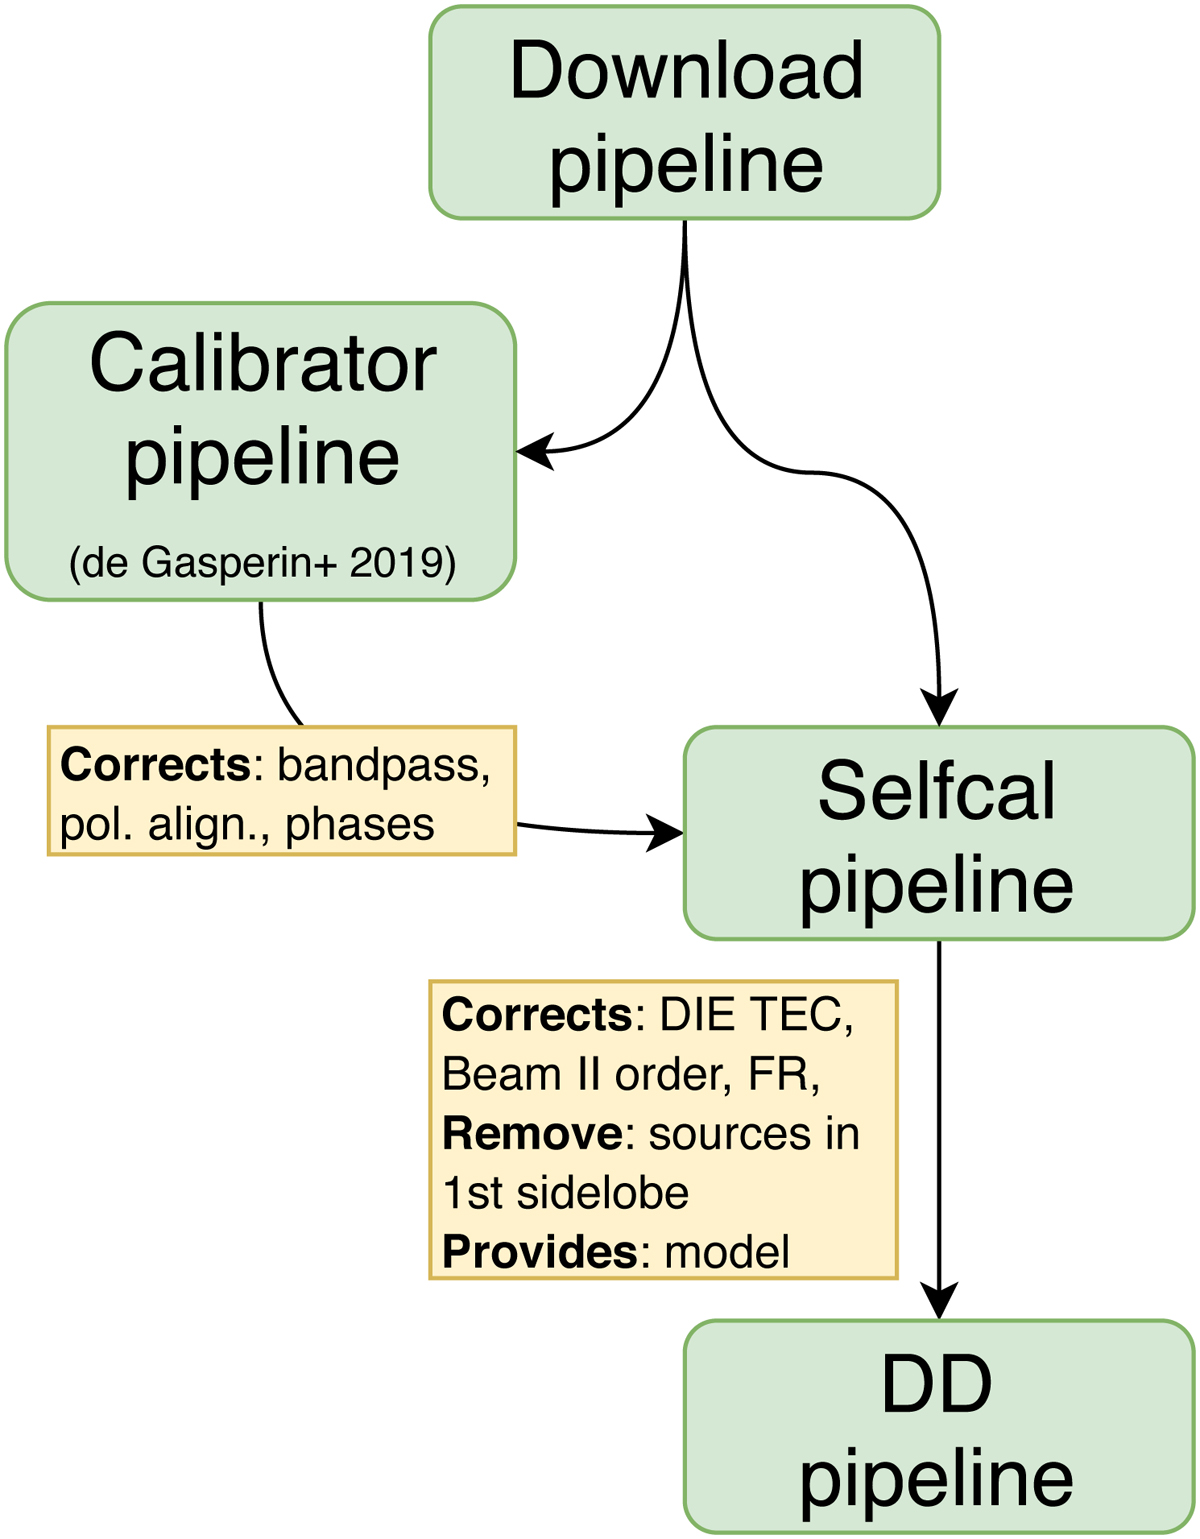
Scheme that summarises the steps of our calibration pipeline that starts after the pre-processing pipeline run by the observatory. In green, we show the four macro-steps described in detail in the text or in de Gasperin et al. (2019). In yellow, we show the effect that one step has on another.
Current usage metrics show cumulative count of Article Views (full-text article views including HTML views, PDF and ePub downloads, according to the available data) and Abstracts Views on Vision4Press platform.
Data correspond to usage on the plateform after 2015. The current usage metrics is available 48-96 hours after online publication and is updated daily on week days.
Initial download of the metrics may take a while.