Fig. 18.
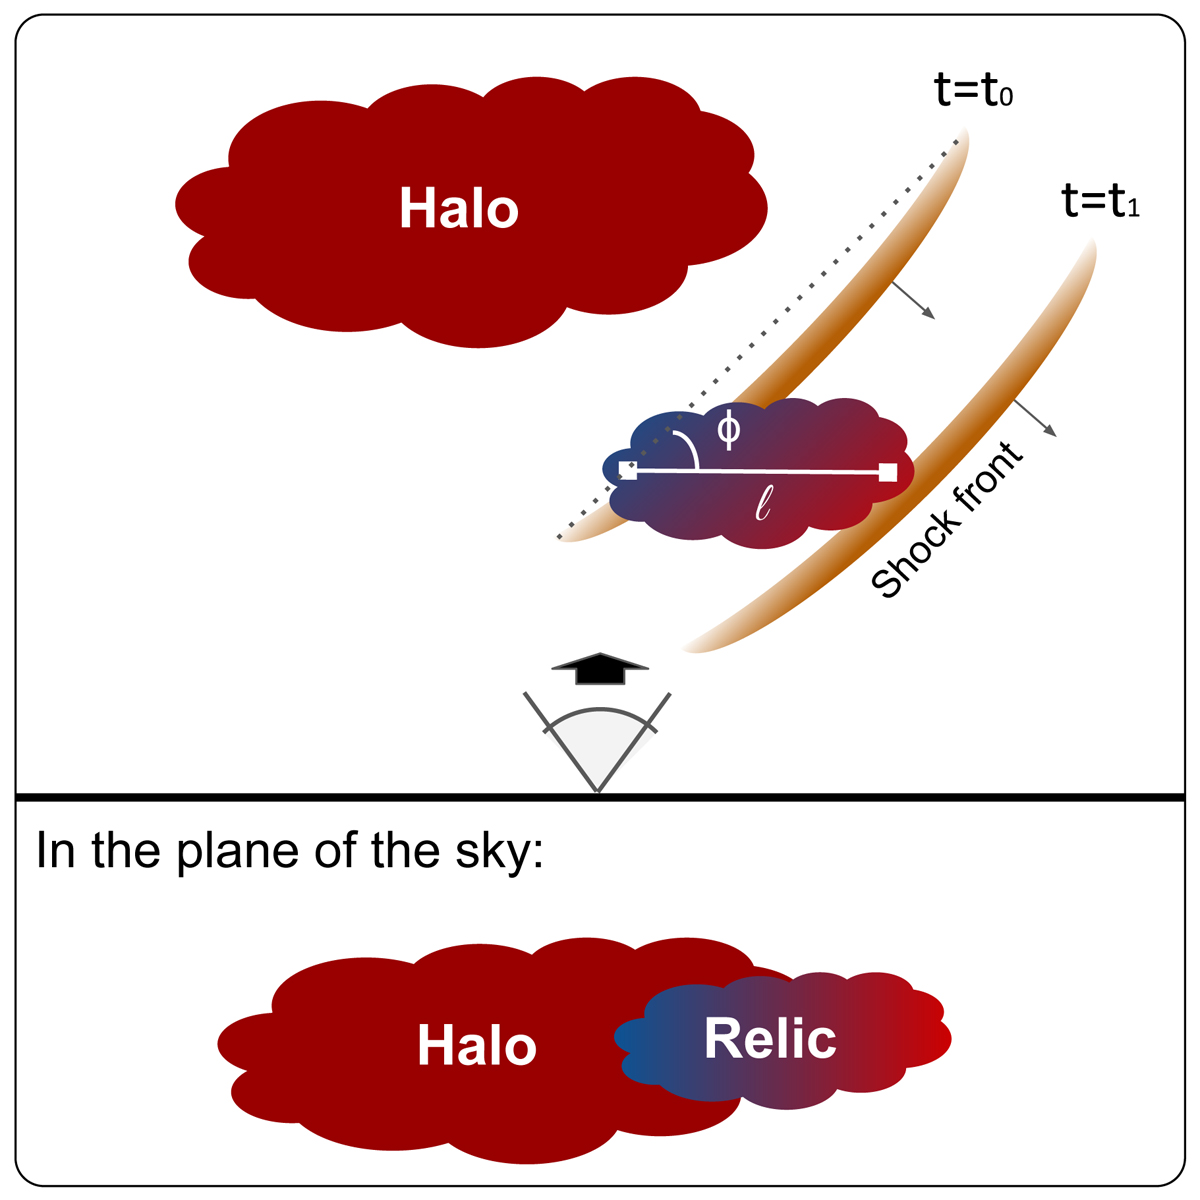
Possible scenario explained in the second part of Sect. 5.3. Top panel: cluster as seen in projection, bottom panel: cluster as it appears in the plane of the sky. We show the shock front in two moments, when it first encounter the cloud of aged plasma (t0) and in the current position (t1). The colour encodes the radio spectral index of the plasma from red (flat) to blue (steep), as it is expected to be at t = t1.
Current usage metrics show cumulative count of Article Views (full-text article views including HTML views, PDF and ePub downloads, according to the available data) and Abstracts Views on Vision4Press platform.
Data correspond to usage on the plateform after 2015. The current usage metrics is available 48-96 hours after online publication and is updated daily on week days.
Initial download of the metrics may take a while.