Free Access
Fig. 17.
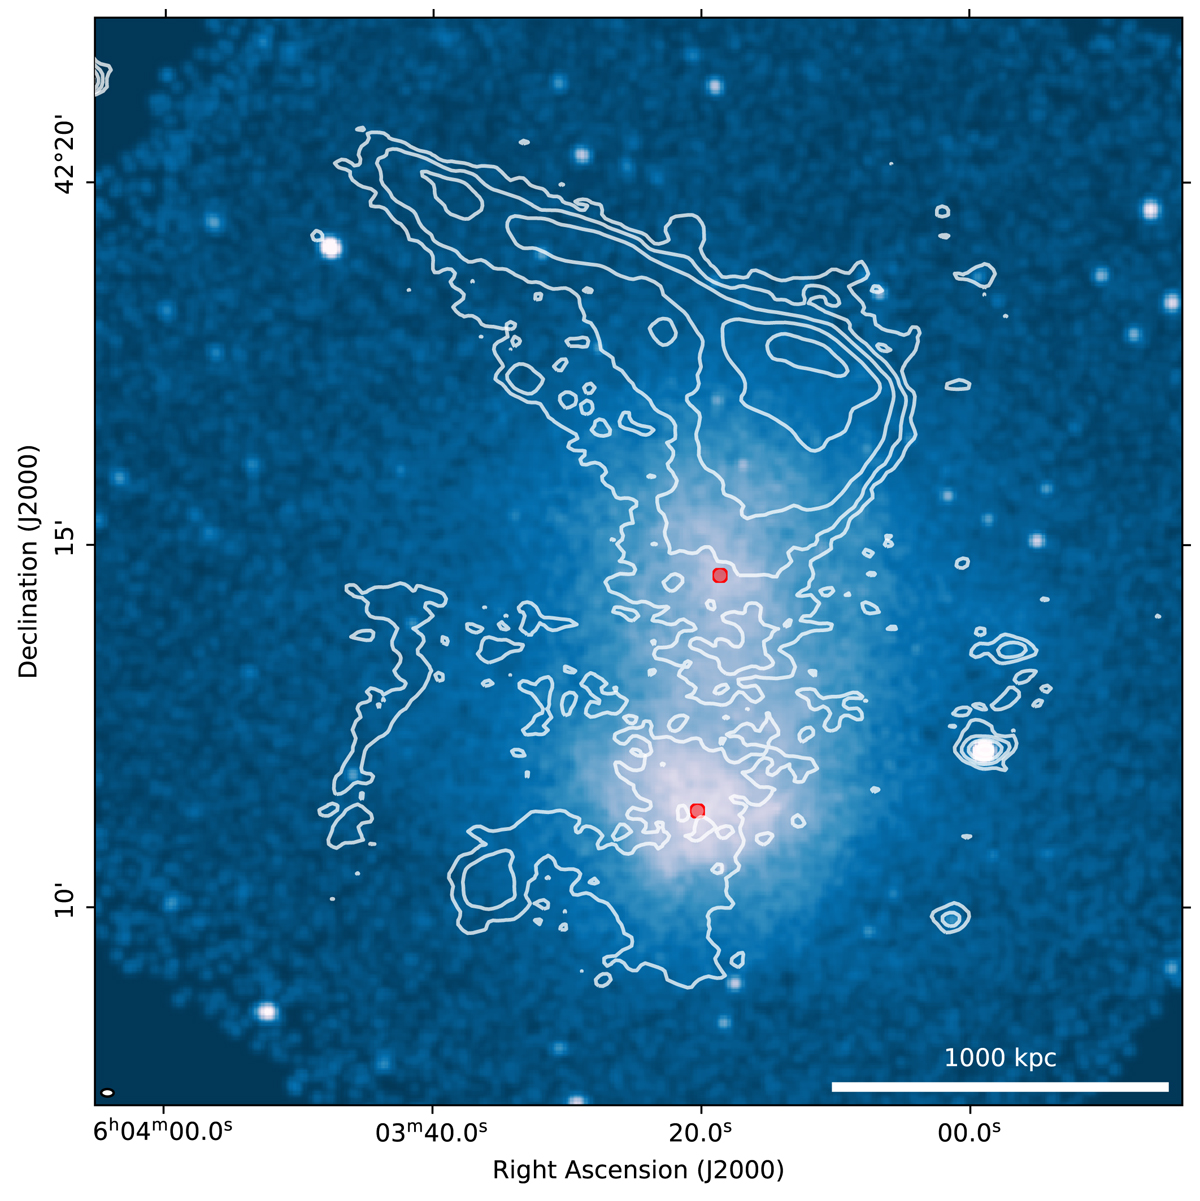
Chandra 0.5–2.0 keV image with superimposed contours from Fig. 12. Red dots show the position of the two X-ray peaks. The emission directly related with the radio relics arrives ∼260 kpc north of the mid-distance between the two markers.
Current usage metrics show cumulative count of Article Views (full-text article views including HTML views, PDF and ePub downloads, according to the available data) and Abstracts Views on Vision4Press platform.
Data correspond to usage on the plateform after 2015. The current usage metrics is available 48-96 hours after online publication and is updated daily on week days.
Initial download of the metrics may take a while.