Fig. 16.
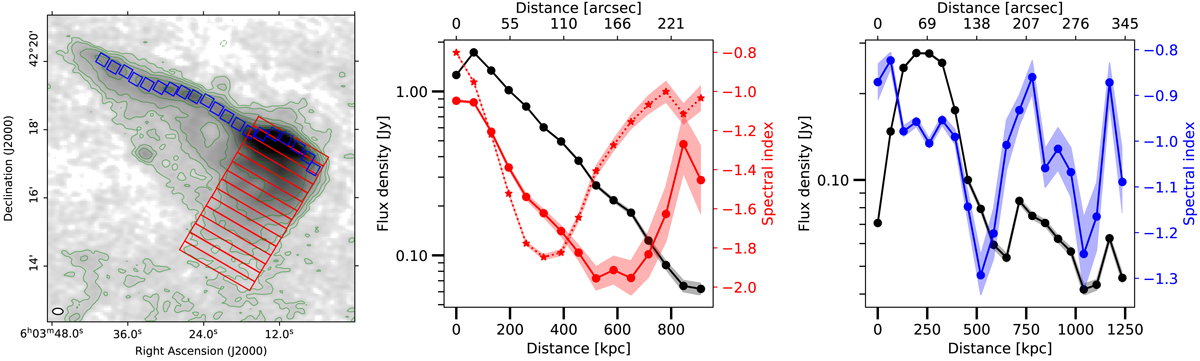
Left: radio map at 58 MHz (same of Fig. 12, right panel) superimposed with the regions used to extract the flux density and the spectral index plotted in the central and right panels. Along the repeating direction, regions have the size of one beam (18″). Centre: black represnts the flux density at 58 MHz and in red, the spectral index between 58 − 150 MHz (dots) and 150 − 1500 MHz (stars) of the red regions (north → south). Right: black represents the flux density at 54 MHz, in blue, the spectral index between 58 − 150 MHz of the blue regions (west → east).
Current usage metrics show cumulative count of Article Views (full-text article views including HTML views, PDF and ePub downloads, according to the available data) and Abstracts Views on Vision4Press platform.
Data correspond to usage on the plateform after 2015. The current usage metrics is available 48-96 hours after online publication and is updated daily on week days.
Initial download of the metrics may take a while.