Fig. 12.
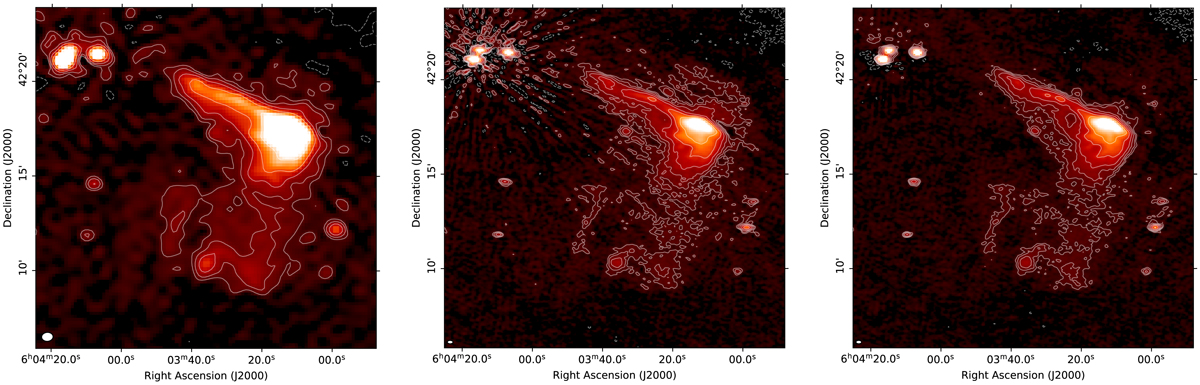
Left: zoom-in on the Toothbrush cluster from Fig. 10 (rms noise: ∼3 mJy beam−1, resolution: 37″ × 29″). Center: same dataset of the image of the left but re-imaged at resolution: 18″ × 11″. Here, the effect of the ionospheric corruption mostly affecting long baselines is evident. Right: final image after direction-dependent calibration and facet self-calibration (rms noise: 1.3 mJy beam−1, resolution: 18″ × 11″). In all images, the synthesised beam is shown in the bottom-left corner.
Current usage metrics show cumulative count of Article Views (full-text article views including HTML views, PDF and ePub downloads, according to the available data) and Abstracts Views on Vision4Press platform.
Data correspond to usage on the plateform after 2015. The current usage metrics is available 48-96 hours after online publication and is updated daily on week days.
Initial download of the metrics may take a while.