Fig. 5
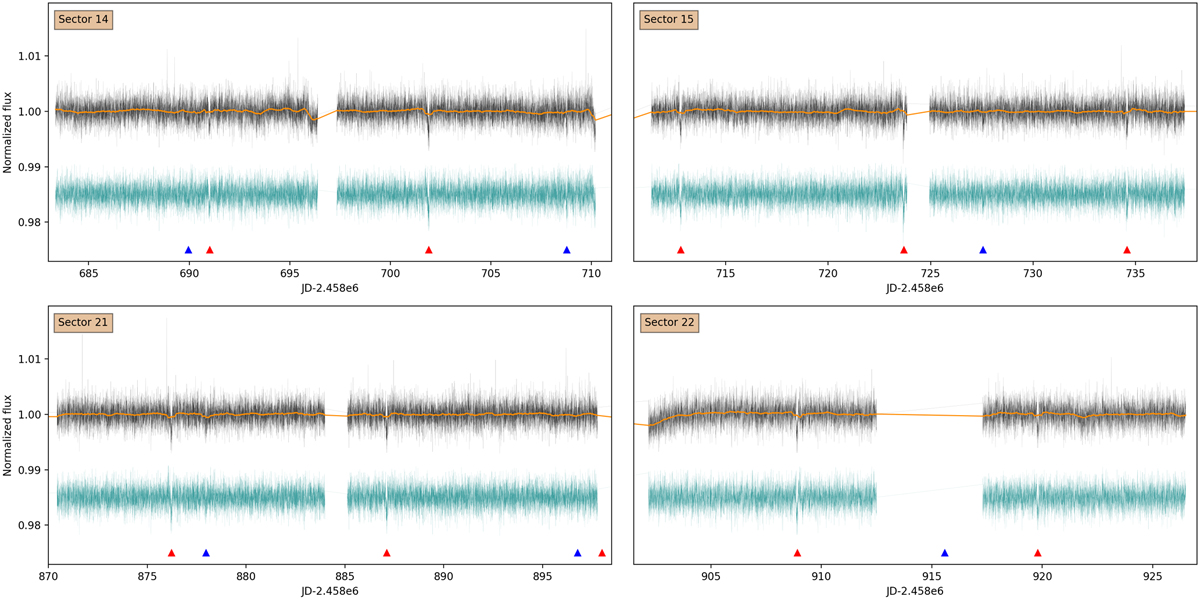
TESS data of TOI-1266 from the four sectors in which it was observed. In all cases, the black line corresponds to the PDC-SAP fluxes obtained from SPOC pipeline, the solid-orange line corresponds to the best-detrended model, and the teal lineis the final detrended lightcurve. The red triangles mark the 10.8 d period planetary candidate, while the blue triangles mark the 18.8 d candidate.
Current usage metrics show cumulative count of Article Views (full-text article views including HTML views, PDF and ePub downloads, according to the available data) and Abstracts Views on Vision4Press platform.
Data correspond to usage on the plateform after 2015. The current usage metrics is available 48-96 hours after online publication and is updated daily on week days.
Initial download of the metrics may take a while.