Fig. 17
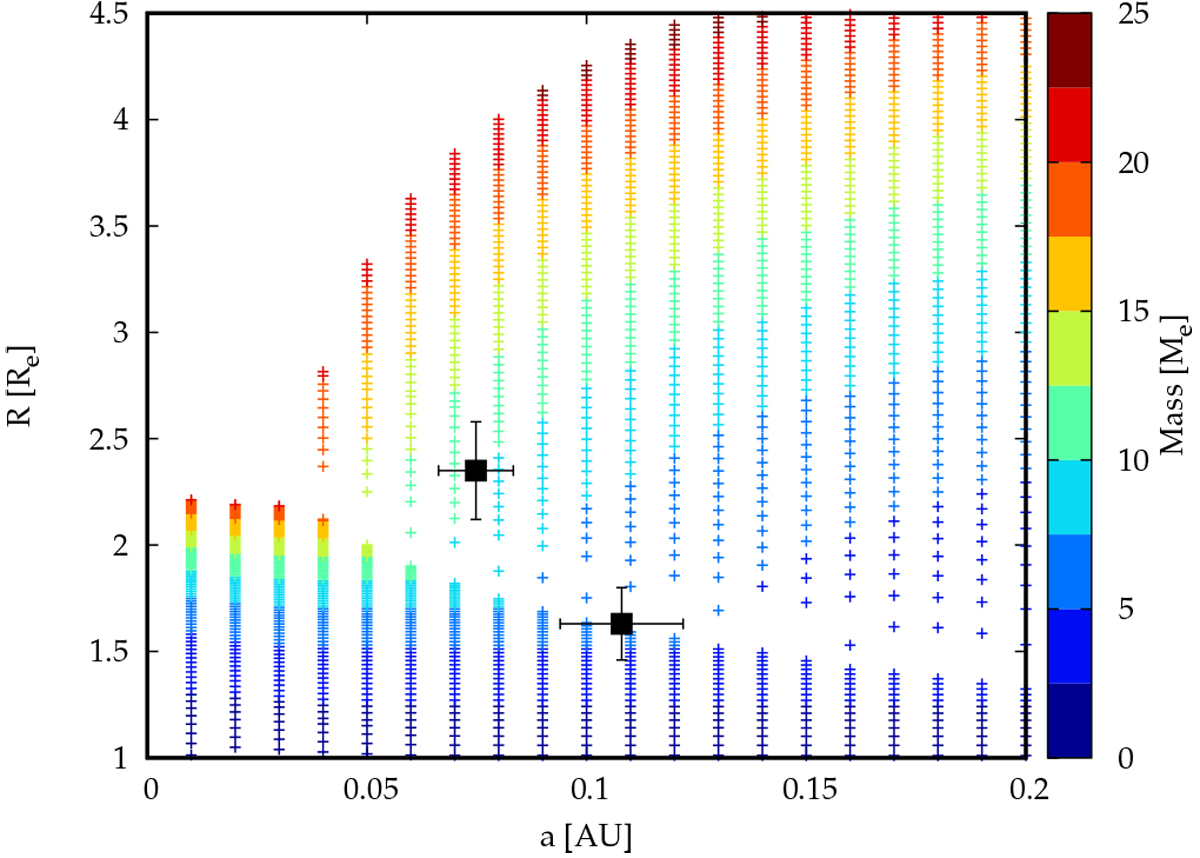
Comparison of TOI-1266 b & c with evaporation models. The coloured dots show the position in the plane of semi-major axis versus radius of simulated planets evolving under the effect of cooling, contraction, and atmospheric escape around a 0.5 M⊙ star at an age of 10 Gyr. One sees the radius valley and the sub-Neptunian desert. The colours show the planet mass. Black symbols show TOI-1266 b & c.
Current usage metrics show cumulative count of Article Views (full-text article views including HTML views, PDF and ePub downloads, according to the available data) and Abstracts Views on Vision4Press platform.
Data correspond to usage on the plateform after 2015. The current usage metrics is available 48-96 hours after online publication and is updated daily on week days.
Initial download of the metrics may take a while.