Fig. 13
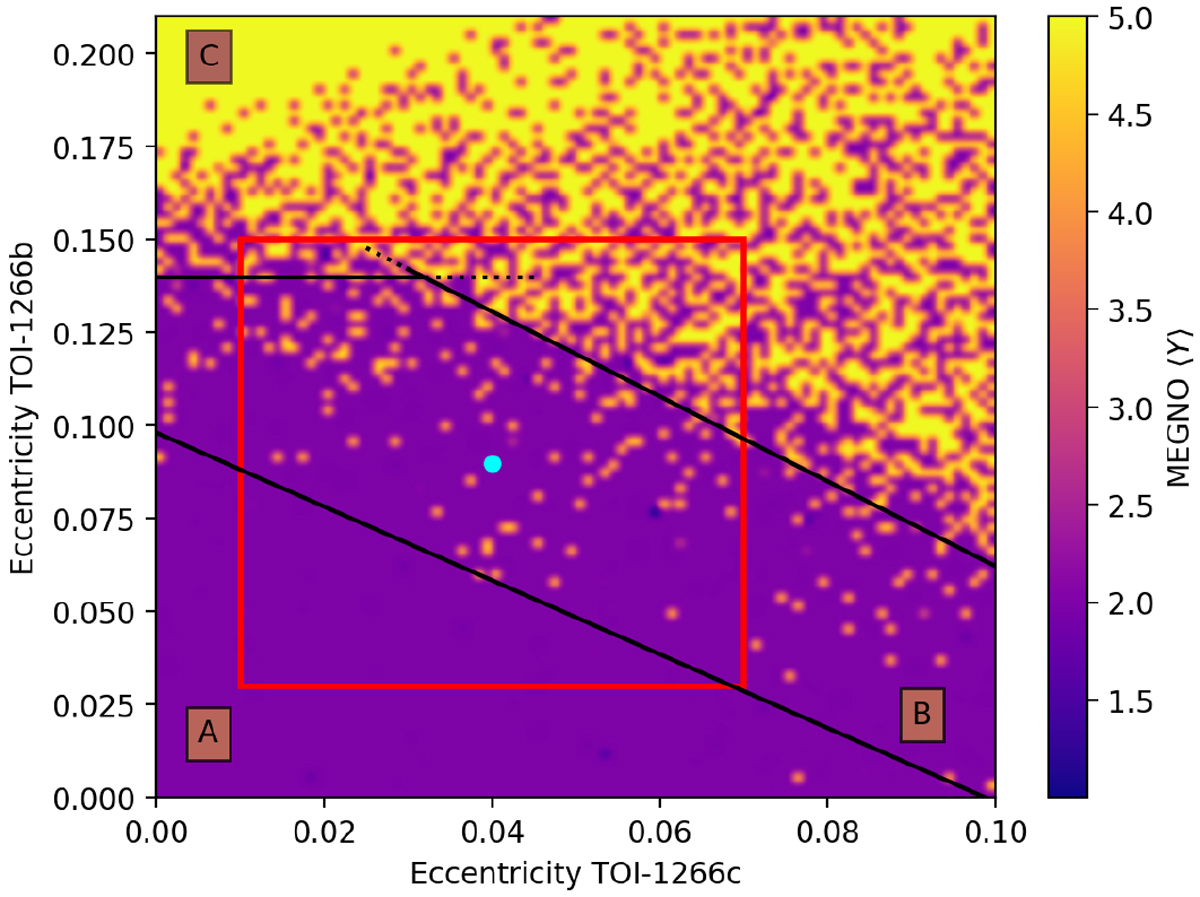
Dynamical analysis of the TOI-1266 system based on a MEGNO-map. The size of the map is 100 × 100 pixels, whichexplores the eb–ec parameter space at the 2-σ uncertainty level. When ⟨Y (t)⟩→ 2 (purple shaded regions), quasi-periodic orbits are found, while chaotic systems are found when ⟨Y (t)⟩ → 5 (yellow shaded regions). The configuration with the nominal values of eb and ec is shown by the blue marker, while the 1-σ uncertainty region is shown by the red box. The three areas, A (stable region), B (transition region), and C (unstable region) have been labelled, and are delimited by the solid black lines, which represent the conditions given by Eqs. (2) and (3).
Current usage metrics show cumulative count of Article Views (full-text article views including HTML views, PDF and ePub downloads, according to the available data) and Abstracts Views on Vision4Press platform.
Data correspond to usage on the plateform after 2015. The current usage metrics is available 48-96 hours after online publication and is updated daily on week days.
Initial download of the metrics may take a while.