Fig. 1
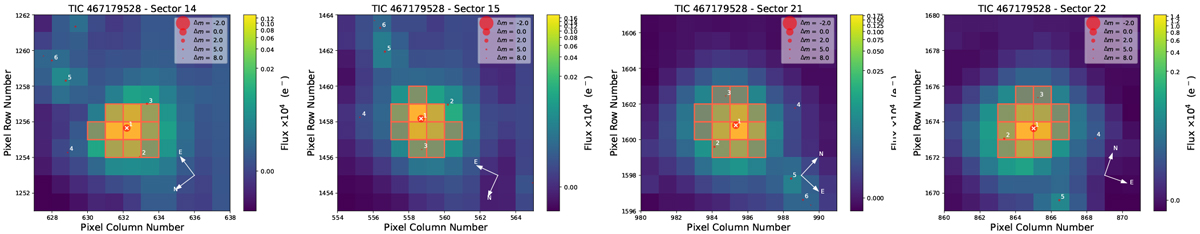
TESS target pixel files (TPFs) of the four sectors that observed TOI-1266. The plots were created with tpfplotter3 (Aller et al. 2020). The apertures used to extract the photometry (Twicken et al. 2010; Morris et al. 2017)by the SPOC pipeline are shown as red shaded regions. The Gaia DR2 catalogue (Gaia Collaboration 2018) is overplotted, with all sources up to 8 magnitudes in contrast with TOI-1266 are shown as red circles. We note that the symbol size scales with the magnitude contrast.
Current usage metrics show cumulative count of Article Views (full-text article views including HTML views, PDF and ePub downloads, according to the available data) and Abstracts Views on Vision4Press platform.
Data correspond to usage on the plateform after 2015. The current usage metrics is available 48-96 hours after online publication and is updated daily on week days.
Initial download of the metrics may take a while.