Fig. 4.
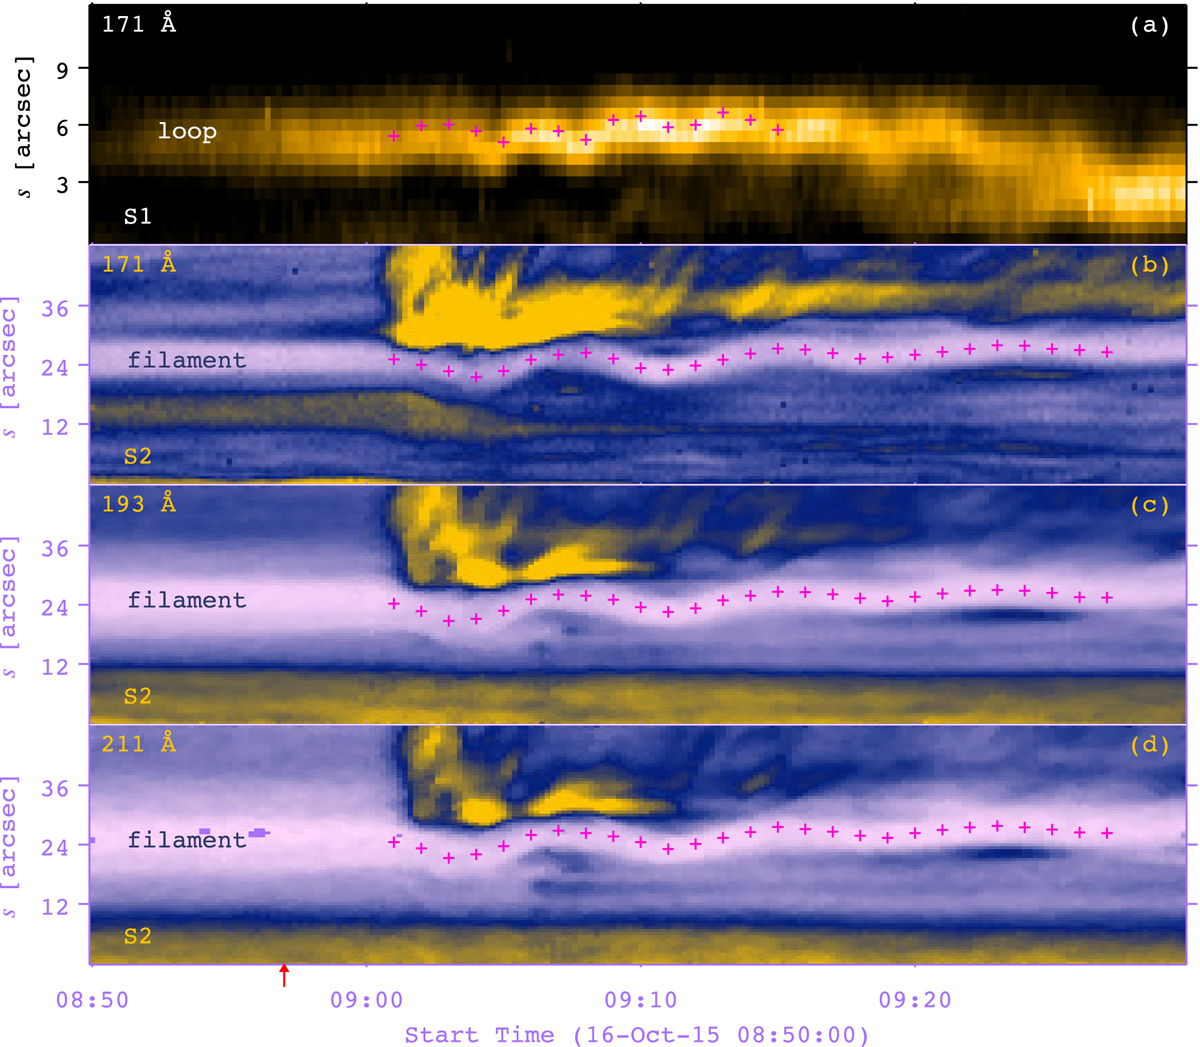
Panel a: time−distance diagram of S1 in 171 Å showing the transverse oscillation of the coronal loop. The magenta plus symbols denote the central positions of the loop. On the y-axis, s = 0 and s = 12″ denote the south and north endpoints of S1, respectively. Panels b–d: time−distance diagrams of S2 in different wavelengths showing the transverse oscillation of the filament. The magenta plus symbols denote the central positions of the filament. On the y-axis, s = 0 and s = 48″ denote the south and north endpoints of S2, respectively. The red arrow on the x-axis signifies the start time of C3.4 flare in SXR.
Current usage metrics show cumulative count of Article Views (full-text article views including HTML views, PDF and ePub downloads, according to the available data) and Abstracts Views on Vision4Press platform.
Data correspond to usage on the plateform after 2015. The current usage metrics is available 48-96 hours after online publication and is updated daily on week days.
Initial download of the metrics may take a while.