Fig. 3.
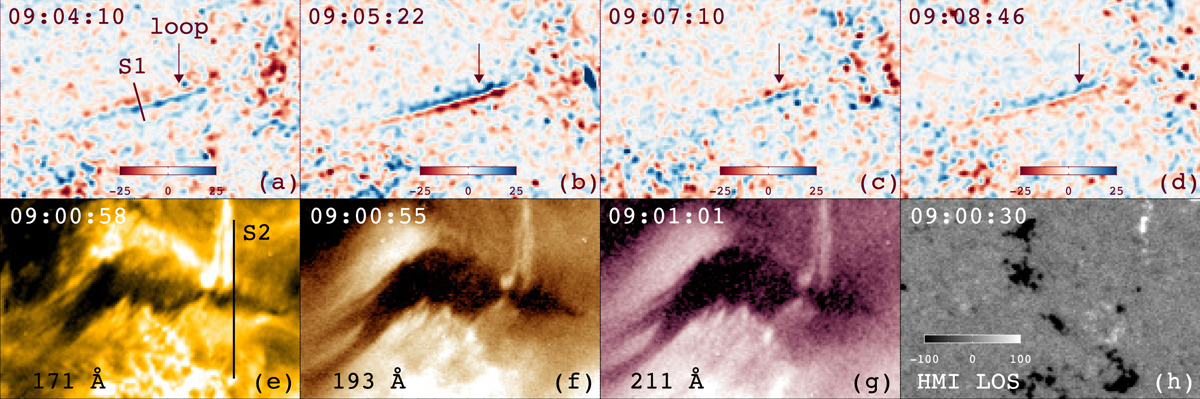
Panels a–d: running-difference images in 171 Å, where blue (red) color represents intensity enhancement (weakening). The slice (S1) is used to investigate the loop oscillation. Panels e–g: close-ups of the filament in 171, 193, and 211 Å. The slice (S2) is used to investigate the filament oscillation. Panel h: HMI LOS magnetogram associated with the filament. The field of view of each panel is 90″ × 60″.
Current usage metrics show cumulative count of Article Views (full-text article views including HTML views, PDF and ePub downloads, according to the available data) and Abstracts Views on Vision4Press platform.
Data correspond to usage on the plateform after 2015. The current usage metrics is available 48-96 hours after online publication and is updated daily on week days.
Initial download of the metrics may take a while.