Free Access
Fig. 2.
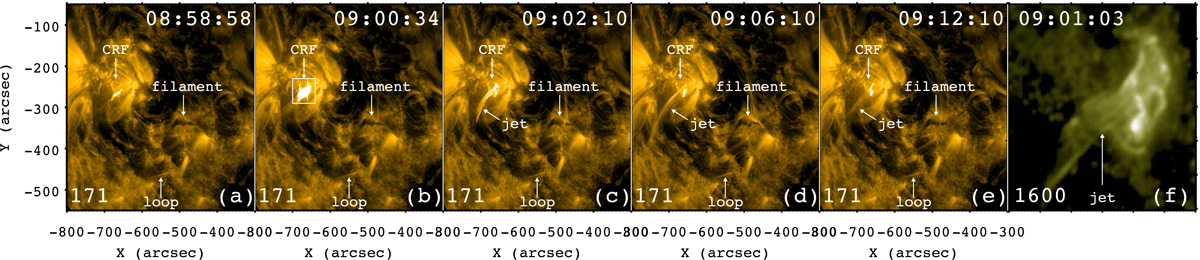
Panels a–e: snapshots of the AIA 171 Å images. The arrows point to the CRF, bright loop, and dark filament. The white box in panel b signifies the flare region. Panel f: close-up of the flare region in AIA 1600 Å. The whole evolution is shown in a movie available online.
Current usage metrics show cumulative count of Article Views (full-text article views including HTML views, PDF and ePub downloads, according to the available data) and Abstracts Views on Vision4Press platform.
Data correspond to usage on the plateform after 2015. The current usage metrics is available 48-96 hours after online publication and is updated daily on week days.
Initial download of the metrics may take a while.