Free Access
Fig. 6
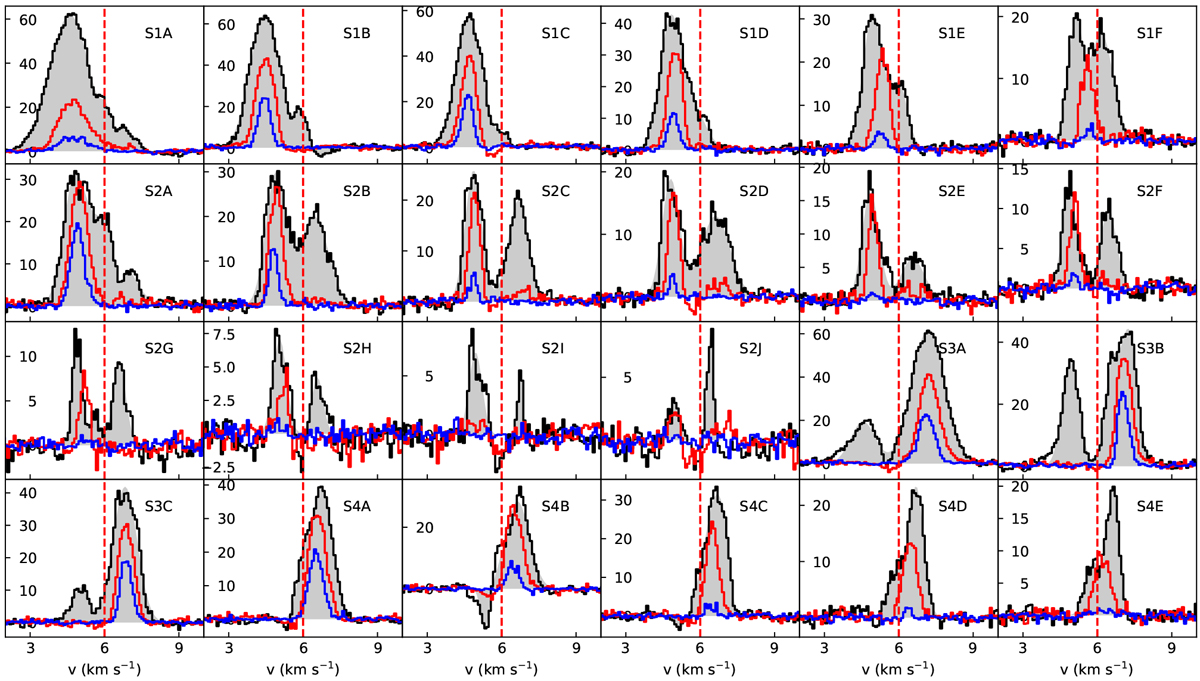
Spectra along the different spiral arms detected by Tang et al. (2012); see red triangles in Fig. 5. We show 12CO in black, 13CO in red, and C18O in blue. The grey shaded areas are Gaussian fits to the observed 12CO spectra.
Current usage metrics show cumulative count of Article Views (full-text article views including HTML views, PDF and ePub downloads, according to the available data) and Abstracts Views on Vision4Press platform.
Data correspond to usage on the plateform after 2015. The current usage metrics is available 48-96 hours after online publication and is updated daily on week days.
Initial download of the metrics may take a while.